Tutorial 3 Optimizing Green Roofs in InfoSWMM Sustain
This example shows the importance of a treatment train, the percent imperious draining to the LID's on a Subcatchment, the importance of optimizing for the number of units, area and soil thickness. Sustain will optimize the number of Green Roofs on the ten Subcatchments.
1. Turn on Width and Thickness on the LID Candidates Grid
2. Allow the number of Units to increase
3. Do NOT send the drainage of the Rain Barrels to the pervious area - no treatment train
4. Allow most of the Rooftop drainage to flow onto the Green or Blue Roofs
Area of Each Unit
The surface area devoted to each replicate LID unit (sq. ft or sq. m).
Number of Replicate Units
The number of equal size units of the LID practice (e.g., the number of rain barrels) deployed within the Subcatchment.
Surface Width Per Unit
The width of the outflow face of each identical LID unit (in ft or m). This parameter applies to green roofs, permeable pavement, infiltration trenches, and vegetative swales that use overland flow to convey surface runoff off of the unit. It can be set to 0 for other LID processes, such as bio-retention cells, rain gardens, and rain barrels that simply spill any excess captured runoff over their berms.
% Initially Saturated
For bio-retention cells, rain gardens, and green roofs this is the degree to which the unit's soil is initially filled with water (0 % saturation corresponds to the wilting point moisture content, 100 % saturation has the moisture content equal to the porosity). The storage zone beneath the soil zone of the cell is assumed to be completely dry. For other types of LIDs it corresponds to the degree to which their storage zone is initially filled with water.
% of Impervious Area Treated
The percent of the impervious portion of the Subcatchment's non-LID area whose runoff is treated by the LID practice. (E.g., if rain barrels are used to capture roof runoff and roofs represent 60% of the impervious area, then the impervious area treated is 60%). If the LID unit treats only direct rainfall, such as with a green roof, then this value should be 0. If the LID takes up the entire Subcatchment then this field is ignored.
Return All Outflow To Pervious Area
Select this option if the surface and underdrain flow from the LID unit should be routed back onto the pervious area of the Subcatchment that contains it. This would be a common choice to make for rain barrels and possibly green roofs.

A Data Copy of the Grid
ID LID Type Subcatch. ID LID Control Replicate Coverage Type Unit Area Coverage Top Width Init. Saturattion % of Imperv. Area Treated Send Flow to Perv. Area Print Report Apply Unit Count Unit Step Min Unit Max Unit Apply Width Width Step Min Width Max Width Apply Soil Thickness Thickness Step Min Thickness Max Thickness Apply LID Area Area Step Min Area Max Area Linear Cost Area Cost Total Volume Cost Soil Media Volume Cost Under Drain Volume Cost Constant Cost Percentage of other Cost Width Exponent Area Exponent Total Volume Exponent Media Volume Exponent Under Drain Volume Exponent
19 12: Green Roof 4 GREENROOF 1 12.000 3.000 25.000 Yes No Yes 1 0 100 Yes 5.000 10.000 5000.000 Yes 1.000 1.000 25.000 No 1.000 1.000 28639.805 1.000 1.000 1.000 1.000 1.000 50.000 20.000 1.000 1.000 1.000 1.000 1.000
24 12: Green Roof 1 GREENROOF 1 12.000 3.000 25.000 Yes No Yes 1 0 100 Yes 5.000 10.000 5000.000 Yes 1.000 1.000 25.000 No 1.000 1.000 28639.805 1.000 1.000 1.000 1.000 1.000 50.000 20.000 1.000 1.000 1.000 1.000 1.000
21 12: Green Roof 6 GREENROOF 1 12.000 3.000 25.000 Yes No Yes 1 0 100 Yes 5.000 10.000 5000.000 Yes 1.000 1.000 25.000 No 1.000 1.000 28639.805 1.000 1.000 1.000 1.000 1.000 50.000 20.000 1.000 1.000 1.000 1.000 1.000
23 12: Green Roof 7 GREENROOF 1 12.000 3.000 25.000 Yes No Yes 1 0 100 Yes 5.000 10.000 5000.000 Yes 1.000 1.000 25.000 No 1.000 1.000 28639.805 1.000 1.000 1.000 1.000 1.000 50.000 20.000 1.000 1.000 1.000 1.000 1.000
22 12: Green Roof 10 GREENROOF 1 12.000 3.000 25.000 Yes No Yes 1 0 100 Yes 5.000 10.000 5000.000 Yes 1.000 1.000 25.000 No 1.000 1.000 28639.805 1.000 1.000 1.000 1.000 1.000 50.000 20.000 1.000 1.000 1.000 1.000 1.000
27 12: Green Roof 5 GREENROOF 1 12.000 3.000 25.000 No No Yes 1 0 100 Yes 5.000 10.000 5000.000 Yes 1.000 1.000 25.000 No 1.000 1.000 28639.805 1.000 1.000 1.000 1.000 1.000 50.000 20.000 1.000 1.000 1.000 1.000 1.000
26 12: Green Roof 9 GREENROOF 1 12.000 3.000 25.000 Yes No Yes 1 0 100 Yes 5.000 10.000 5000.000 Yes 1.000 1.000 25.000 No 1.000 1.000 28639.805 1.000 1.000 1.000 1.000 1.000 50.000 20.000 1.000 1.000 1.000 1.000 1.000
25 12: Green Roof 8 GREENROOF 1 12.000 3.000 25.000 Yes No Yes 1 0 100 Yes 5.000 10.000 5000.000 Yes 1.000 1.000 25.000 No 1.000 1.000 28639.805 1.000 1.000 1.000 1.000 1.000 50.000 20.000 1.000 1.000 1.000 1.000 1.000
20 12: Green Roof 2 GREENROOF 1 12.000 3.000 25.000 Yes No Yes 1 0 100 Yes 5.000 10.000 5000.000 Yes 1.000 1.000 25.000 No 1.000 1.000 28639.805 1.000 1.000 1.000 1.000 1.000 50.000 20.000 1.000 1.000 1.000 1.000 1.000
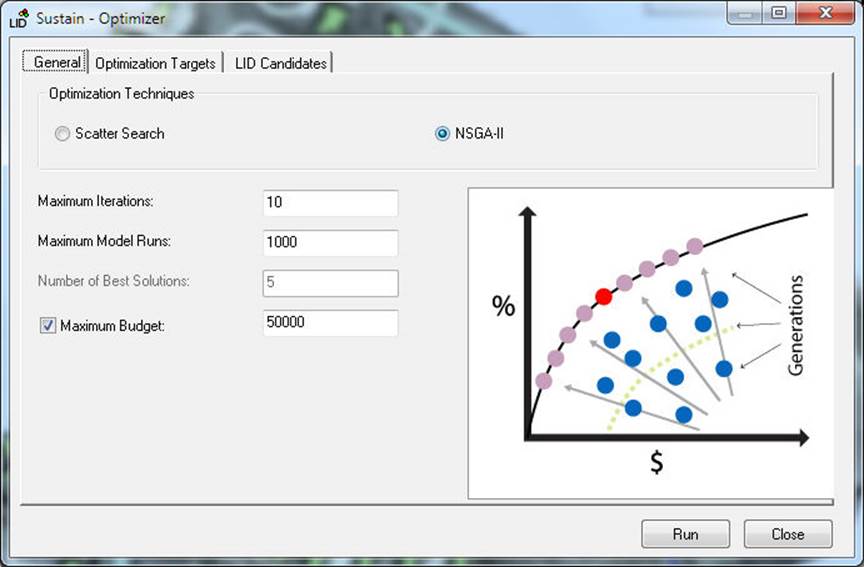
Our Optimization Goals
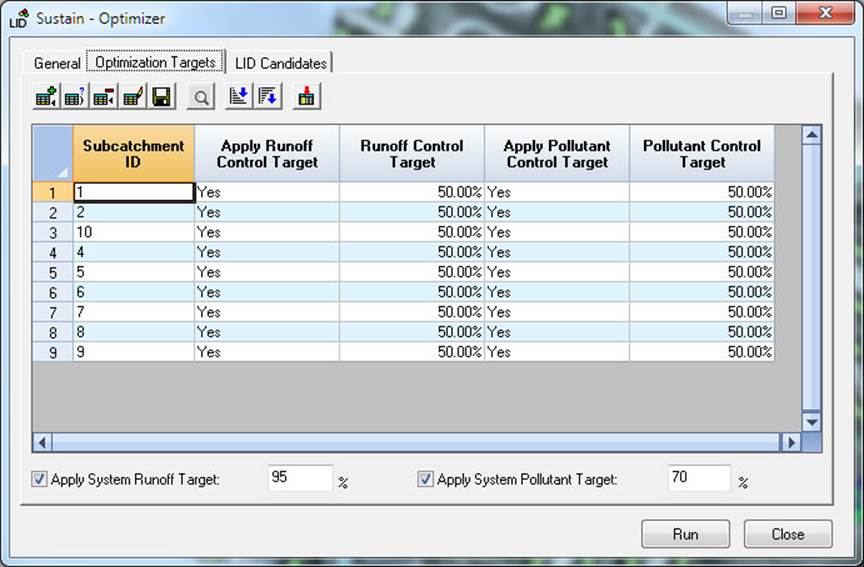
Use NSGA-II Optimization to find the Cost Boundary Curve
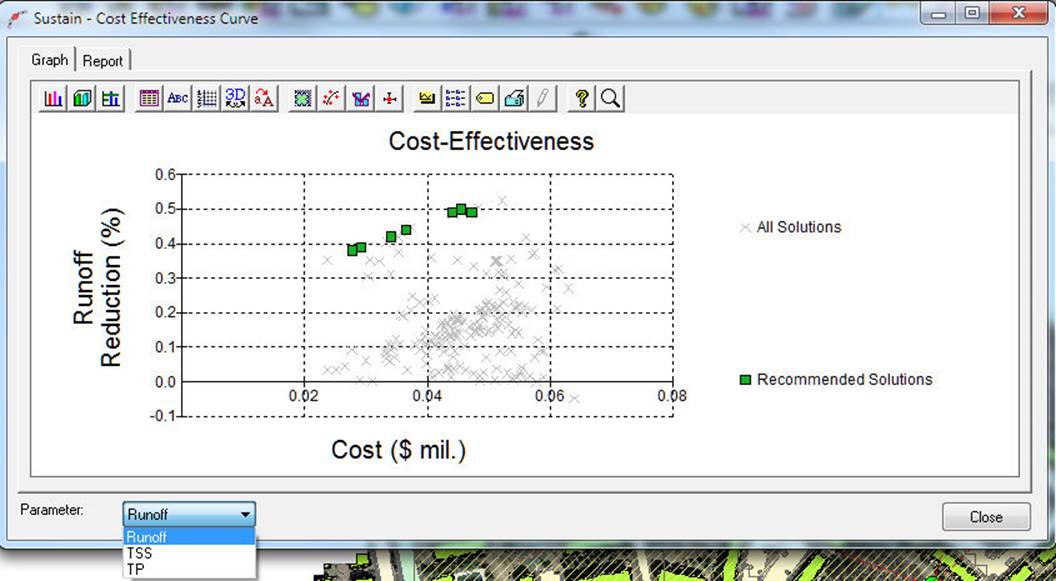
The Cost Effectiveness Curves for Runoff and Water Quality
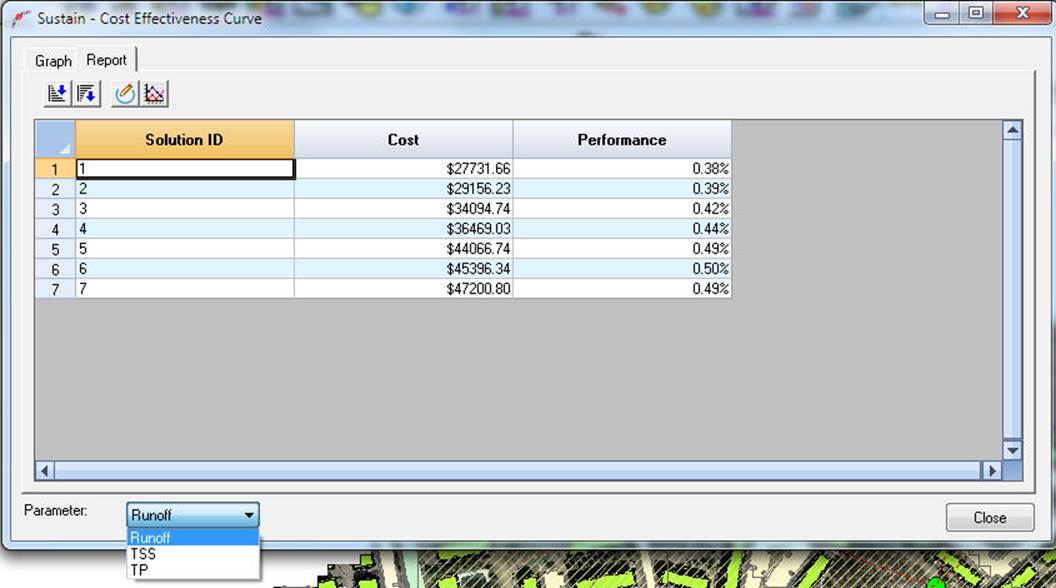
The Cost Effectiveness Report for Runoff and Water Quality
There is little removal as the Rain Barrels are not sending the overflow to the pervious area and there is little storage in a Rain Barrel.
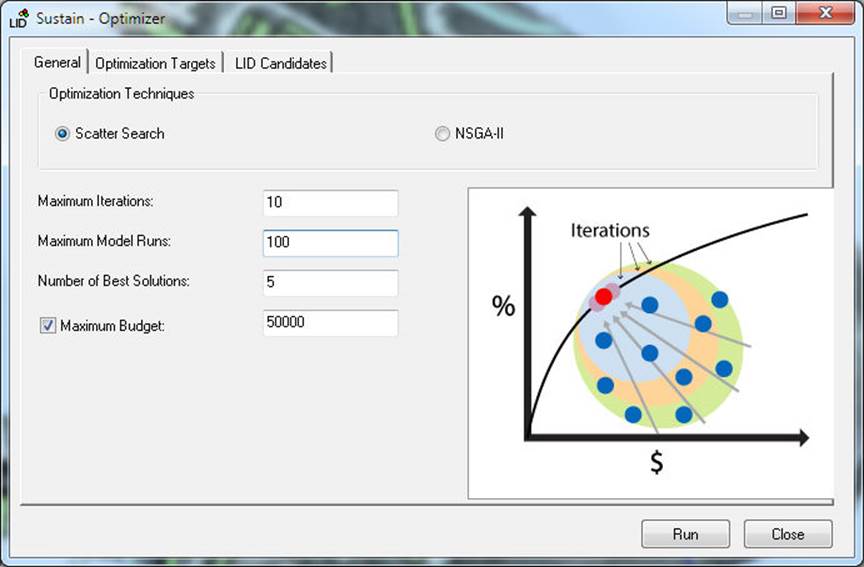
Use Scatter Search to Find the Best Solutions

Leave a Reply