Tutorial 1 Creating a Simple Green Roof Optimization for Sustain 4.0
In Tutorial 1 we will use the Siting Manager to Site Green Roof LID Types for later Optimization and Export to the InfoSWMM LID Usage DB Table. Tutorial 1 is designed for first-time users of InfoSWMM Sustain and provides a guided tour to core commands and functions used to create and execute a Siting and Optimization run in InfoSWMM Sustain. As such, it should be used as a launching point to a more comprehensive understanding of the program. This tutorial assumes you have already added your GIS data to the example model of InfoSWMM Sustain.
The GIS data and the Sample Sustain Model will be found in your InfoSWMM Examples folder
C:UsersPublicDocumentsInfoSWMMExamples
The folder will have the Arc Map MXD file, the DB folder and the GIS Data needed for Tutorial 1.

The major tasks in using InfoSWMM Sustain are the following:
- Use the Siting Manager to Add New LID's based on the GIS Rules as set up in the Ground Conditions Dialog
- Use the Optimizer tool to select LID Candidates for Optimization
- Optimize or find the Best Solutions using Scatter Search or the Optimal Cost Solution using GA
- Review the Design Report, Performance Report and Cost Effectiveness Curve
- Decide which of the Designs will be applied to InfoSWMM
- Use the LID Usage Table exported from Sustain in your InfoSWMM model.
STEP 1: Use the Siting Manager to Choose Green Roofs
Use the Siting Manager and Click on the Add LID Types
STEP 2: Select the Green Roof LID Type
You add one LID Type and define the Siting Criteria one LID Type at a time.
STEP 3: Define the LID Siting Criteria for Green Roofs
Use only the Criteria for Building Buffer and Percent Imperviousness as shown below:

STEP 4: Click on Process to Find the Possible Sites for the Green Roofs
The InfoSWMM Message Board Window will show creation notes and whether there were any errors in the creation of the Green Roofs.
STEP 5: Open the LID Types Atrribute Table to see the Green Roof Possible Locations
The Siting Manager will find Green Roofs for the whole watershed but we will only use the LID Types on a Subcatchment.

STEP 6: Use the LID Optimizer Tool
Use the LID Optimizer tool (1) to import all of the LID's with a Subcatchment (2).

STEP 7: Import all of the LID Candidates found by the Siting Manager of InfoSWMM Sustain
All of the possible Green Roofs on Subcatchments 1, 2 and 3 are now found. You have to decide the actual LID Control for each LID Type. It is possible to have more than one LID Control (from the Operations Tab of the InfoSWMM Browser) for all of the Green Roofs. Click on the LID Control Box and Select a LID Control.
STEP 8: Set the LID Control for all Rows of the LID Candidate Rows
Use the BlockEdit Tool or Icon to set the LID Control for all of the other Rows with an LID Type of Green Roof.
STEP 9: View the Optimization Targets for Runoff and Water Quality
We will use the preset targets of 89 percent for Runoff and Water Quality for all of the Subcatchments.
STEP 10: Click on the General Tab to Define the Optimizer Parameters
The parameters are for type of Optimization Technique, the Cost Improvement Threshold, the Maximum Number of Iterations per Model Run, the Maximum InfoSWMM Model runs and the Number of Best Solutions to be Found during the Optimization Process.
STEP 11: Moodify the Percent Imperviousness Area Treated
An important rule is that the total area treated by all LID Types for a particular Subcatchment does not exceed 100 percent of the impervious area. Use the BlockEdit tool again and set the Percent Imperviousness Area Treated to 5 percent per LID Type.
STEP 12: Reduce the Number of LID Types for this Introductory Tutorial
Sort the LID Type Rows by Unit Area and then using the delete Row Icon delete all except the 1st Two Rows
STEP 13: The Reduced Number of LID Candidates
The Number LID Candidates should be two now and the ID's should be 173 for Subcatchment 2 and ID 199 for Subcatchment 1.
STEP 14: Run the Optimizer
The Optimizer runs many InfoSWMM runs to optimize the selected LID Types. Click on Run and you will see a Blue progress bar at the bottom of the screen and at the end of the Run an Info Dialog Message Box.
STEP 15: Click on the Design Report to See the Optimized Solutions.
The Optimized solution for each of the found Best Solutions are shown in the Report Grid.
STEP 16: Click on the Performance Report to see if the Control Targets were Met during the Run.
The Control targets of 89 percent for Runoff and Water quality were met in this Optimization Run.
STEP 17: Cost Effectiveness Curve for Sustain 4.0
The Cost Effectiveness Curve shows the Recommended Solutions (Green), Best Solution (red) and all of the Solutions (grey).
-

- image017
-

- image018
STEP 18: The Cost Effectiveness Curve Report for Sustain 4.0
Click on the Report Tab of the Cost Effectiveness Curve to see the Runoff Reduction and Performance for all of the Recommended Solutions.
STEP 19: Click on the LID Performance Report to choose a Best Solution to Apply to the InfoSWMM LID Usage Table
Decide on which solution to Apply to InfoSWMM. The Graph Icon report will help you decide.
-

- image020
-

- image021
STEP 20: Click on Apply to InfoSWMM
If the InfoSWMM LID Usage Table has been updated then your will get a Confirmation Message Dialog Box.

STEP 21: Edit the InfoSWMM DB Tables and Select LID Usage
You will see the LID Controls that were applied from InfoSWMM Sustain to InfoSWMM. These LID's will be used in the InfoSWMM Simulation.

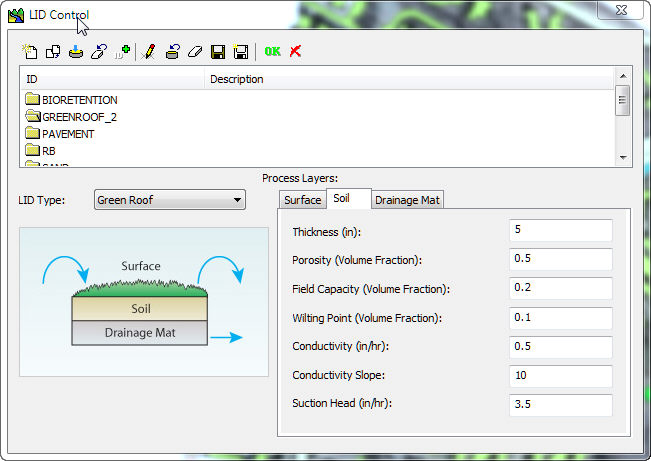
STEP 22: Click on the LID Controls under Hydrology in the InfoSWMM Attribute Browser.
The optimized Green Roof parameters will be shown for each Process Layer.
STEP 23: Click on Report Manager to see the LID Result Reports
The LID results can be seen graphically, in the LID Report and in the LID Summary Report.

STEP 24: Click on Report Manager to see the LID Summary Reports
This summary table can also be seen in the HTML LID Report of InfoSWMM.

STEP 25: Click on Report Manager to see the LID Graphs
You can see up to 10 Process Graphs for LID's in InfoSWMM.

This ends the short tutorial for optimizing Green Roofs in InfoSWMM Sustain. The remaining Tutorials will expand on this view of InfoSWMM Sustain.
Privileged and Confidential Communication: This electronic mail communication and any documents included hereto may contain confidential and privileged material for the sole use of the intended recipient(s) named above. If you are not the intended recipient (or authorized to receive for the recipient) of this message, any review, use, distribution or disclosure by you or others is strictly prohibited. Please contact the sender by reply email and delete and/or destroy the accompanying message.

Leave a Reply