Water Quality Capability in InfoSewer and H2OMap Sewer
H2OMAP Sewer provides seven options for sewage quality analysis in conjunction with a hydraulic simulation. The purpose of the quality model is to simulate loading, buildup and washoff, and transport of various water quality constituents resulting from domestic, commercial, and industrial wastes.
These options are available only for EPS/Dynamic runs, and may be chosen on the Quality panel from the Simulation Options dialog box given below.
Time of Concentration
Time of concentration (TOC) is the time spent by a sewage flow parcel in the network (i.e., the time of flow in the sewerage system). New sewage entering the network from loading manholes is assigned age of zero. When the model is run under constant hydraulic conditions, the age of sewage at any location in the network can be interpreted as the time of travel to that location. This parameter is useful to address important water quality and safety issues such as generation of sulfide that may occur in a sanitary sewer system, and its subsequent results such as corrosion and odor issues.
Time of concentration analysis could be performed by clicking ![]() on the quality panel of the simulation options dialog box. No additional input parameter is required.
on the quality panel of the simulation options dialog box. No additional input parameter is required.
Source Tracing
Source tracing tracks over time what percent of sewage reaching any pipe or manhole in the network had its origin at a particular source node. The source node can be any manhole in the network, including wet-wells. Source tracing is very useful in sewer collection systems, and could be used for (1) tracking changes in sewage flow contribution (and associated constituents) over space and time; (2) predicting impact of industrial and commercial waste discharges on performance of wastewater treatment plants; (3) determining contaminant level that causes a wastewater treatment plant to be in violation of its discharge permits; (4) and developing appropriate user charges based on wasteloads and level of contaminant.
Source Tracing simulation is initiated by clicking on the ![]() tab of the quality panel (shown above). As soon as the trace tab is selected, trace node specification tab is activated enabling the user to select the desired source Node. Only one source node can be selected for a given simulation. H2OMAP Sewer treats the source node as a constant source of a non-reacting constituent that enters the network with a concentration of 100% throughout the simulation period. Temporal trend of the percentage of the sewage flow originating from the source node is provided as output for pipes and manholes draining the source node.
tab of the quality panel (shown above). As soon as the trace tab is selected, trace node specification tab is activated enabling the user to select the desired source Node. Only one source node can be selected for a given simulation. H2OMAP Sewer treats the source node as a constant source of a non-reacting constituent that enters the network with a concentration of 100% throughout the simulation period. Temporal trend of the percentage of the sewage flow originating from the source node is provided as output for pipes and manholes draining the source node.
Pollutant Transport
H2OMAP Sewer can also track the movement of conservative constituents (e.g., chloride, bromide, sulfate, boron, sorbed trace metals) flowing through the network over time. The dynamic quality simulation model is predicated on conservation of mass coupled with reaction kinetics and consists essentially of three processes: advection in pipes, mixing at sewer manholes and wet-wells, and kinetic reaction mechanism. The ability to model pollutant transport in sewer collection systems is useful in determining the amount of pollutant that is transported to the wastewater treatment plant and assessing impact on the receiving waters.
Using H2OMAP Sewer, the user can model transport of conservative pollutants by first clicking on the ![]() tab of the quality dialog box given below. Unlike the source tracing analysis described above, source nodes could be multiple for pollutant transport simulation. Initial concentration of the source nodes could also vary from a source node to another.
tab of the quality dialog box given below. Unlike the source tracing analysis described above, source nodes could be multiple for pollutant transport simulation. Initial concentration of the source nodes could also vary from a source node to another.
Initial concentrations for the desired source node(s) can be specified using either of the following two ways.
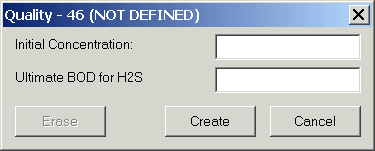
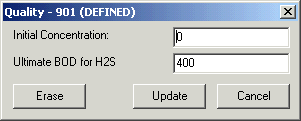
In the first approach, the user has to select a source node (only one node at a time), and then has to click on the Quality icon (![]() ) located at the top of theAttribute Browser. The quality icon initiates the following dialog box through which the initial concentration (in mg/l) could be edited. Note that ultimate BOD data is not required for pollutant transport modeling. This process needs to be repeated for all source nodes.
) located at the top of theAttribute Browser. The quality icon initiates the following dialog box through which the initial concentration (in mg/l) could be edited. Note that ultimate BOD data is not required for pollutant transport modeling. This process needs to be repeated for all source nodes.
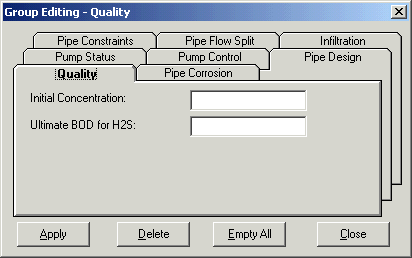
The second approach involves creating domain of the source nodes. Once the domain is created, the user has to perform the following tasks.
· Click on edit from the Menu bar and then on Group Editing on Domain (![]() ). As an alternative, Group Editing on Domain could be directly accessed from the tool bar.
). As an alternative, Group Editing on Domain could be directly accessed from the tool bar.
· Choose quality from the Group Editing dialog box. Then specify the initial concentration in mg/l. Performing these two steps implies that all nodes in the domain are source nodes, and that they all have the same initial concentration. Note that ultimate BOD data is not required for pollutant transport modeling.
Sediment Transport
Sanitary sewer systems can carry substantial loads of suspended solids (waste solids) which can accumulate and cause blockages thereby impairing the hydraulic capacity of the sewer pipes (by restricting their flow area and increasing the bed friction resistance). H2OMAP Sewer can simulate the transport and gravitational settling of sediments (total suspended solids including grit) over time throughout the sewer collection system under varying hydraulic conditions. As long as flow velocity exceeds the critical/terminal velocity, H2OMAP Sewer assumes that the sewage flow has the capacity to transport all incoming sediments. Deposited sediment particles are also assumed to be scoured and transported downstream when velocity of the sewage flow exceeds the terminal velocity. Settling starts when flow velocity falls below the critical velocity. In the model, transport of the sediment particles is governed by advection implying that the particles are transported at local flow velocity.
Sediment transport modeling using H2OMAP Sewer requires only few inputs, namely limiting flow velocity, particle settling velocity, and source node(s) and initial sediment concentrations (in mg/l) at the source nodes.
In order to specify the first two inputs (i.e., limiting flow velocity and particle settling velocity), the user should first select ![]() from the quality tab which in turn activates the editing tabs for particle settling velocity and limiting flow velocity. Specification of source node(s) and its/their initial concentration is similar to the method described above in relation to pollutant transport. The default values used by the model for limiting flow velocity and particle settling velocity are 2 ft/s and 0.1 ft/s, respectively. User specified values over rid these default figures.
from the quality tab which in turn activates the editing tabs for particle settling velocity and limiting flow velocity. Specification of source node(s) and its/their initial concentration is similar to the method described above in relation to pollutant transport. The default values used by the model for limiting flow velocity and particle settling velocity are 2 ft/s and 0.1 ft/s, respectively. User specified values over rid these default figures.
Sediment deposition (in kg) in pipes and sediment concentration (in mg/l) at manholes, wet wells, and outlets are the outputs reported following successful simulation of sediment transport for a collection system.
Note that the ultimate BOD data is not required for modeling of sediment transport and deposition.
Biochemical Oxygen Demand
Biochemical Oxygen Demand (BOD) is the most widely used parameter of organic pollution in sanitary sewer systems. The ability to model BOD is of great importance in wastewater engineering to assist wastewater utilities in (1) estimating the quantity of oxygen required to biologically stabilize the organic matter present; (2) determining the size of wastewater treatment facilities; (3) evaluating the efficiency of the treatment process; and (4) ensuring compliance with wastewater discharge permits. H2OMAP Sewer models the rate of BOD oxidation (exertion) using first-order kinetics with the rate of oxygen utilization being proportional to the difference between the amount of oxygen used and the ultimate BOD (UBOD).
UBOD at source node(s), average daily temperature (in oC) of the study area at the simulation day, and the first-order reaction rate constant corresponding to temperature of 20oC are the input parameters required by the model to simulate BOD for the sewer collection system. Internally, H2OMAP Sewer determines and uses appropriate value of the reaction rate constant depending on the user-specified temperature and the kinetic rate constant corresponding to temperature of 20oC. The default values used by H2OMAP Sewer for first-order reaction rate constant and temperature are 0.23/day and 20oC, respectively.
Average daily temperature and first-order reaction rate constant are specified by first clicking on ![]() which automatically activates the editing tabs for the two input parameters. Source nodes and their corresponding UBOD could be provided following the procedure given above in connection with pollutant transport. Here it should be noted that, the initial concentration data is what is regarded as UBOD during BOD modeling. The potentially confusing additional "Ultimate BOD for H2S" data is not required during BOD modeling. This information is used for hydrogen sulfide (H2S) modeling and corrosion prediction.
which automatically activates the editing tabs for the two input parameters. Source nodes and their corresponding UBOD could be provided following the procedure given above in connection with pollutant transport. Here it should be noted that, the initial concentration data is what is regarded as UBOD during BOD modeling. The potentially confusing additional "Ultimate BOD for H2S" data is not required during BOD modeling. This information is used for hydrogen sulfide (H2S) modeling and corrosion prediction.
Note: Source nodes can only be loading manholes and/or wet wells during source tracing analysis, and modeling of pollutant transport, sediment transport, and BOD.
Hydrogen Sulfide
The control of odorous gases and the corrosion of sewers are the two most important problems in operating wastewater collection systems. H2S is the most commonly known and prevalent odorous gas associated with domestic wastewater collection and treatment systems. H2S DetectorTM extension for H2OMAP Sewer suite gives wastewater engineers a powerful Operations and Maintenance (O&M) tool to readily model and analyze entire sewer collection systems for sulfide generation and corrosion potential under varying conditions anticipated throughout the life of their systems. H2S Detector predicts sulfide buildup in sewer collection systems for gravity sewers, force mains, and wet wells using the Pomeroy-Parkhurst equations. This unique and powerful tool enables wastewater utilities to pinpoint odor and corrosion problems, develop effective monitoring programs, alert plant operators and sewer maintenance workers to potential danger and the need to observe safety practices, and evaluate and implement effective control system such as aeration, chlorination, and mechanical cleaning.
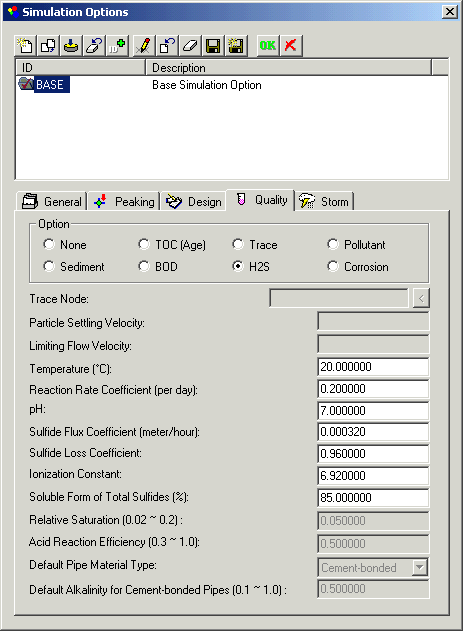
Modeling of hydrogen sulfide using H2S Detector requires minimal input data from the user. The required data include:
· average daily temperature for the region (in oC).
· reaction rate coefficient (per day) which was described above in relation to BOD modeling.
· pH of the wastewater. The normal pH range of municipal wastewater is 6.0 to 8.0.
· effective sulfide flux coefficient for sulfide generation by the slime layer in gravity sewers (meter/hour). For conservative analysis (i.e., observed sulfide buildup generally less than predicted), the suggested values of this parameter is 0.00032.
· a dimensionless coefficient to account for sulfide losses by oxidation and escape to atmosphere. For conservative analysis (i.e., observed sulfide buildup generally less than predicted), the suggested values of this parameter is 0.64. For moderately conservative analysis a value of 0.96 is suggested.
· logarithmic ionization constant for hydrogen sulfide (unit less), a function of temperature and specific electrical conductance of the waste water. Its value generally varies from 6.67 (at a temperature of 40oC and specific electrical conductance of 50, 000 micromhos/cm) to 7.74 (at a temperature of 10oC and specific electrical conductance of 0 micromhos/cm).
· percent of total sulfides that occur in the soluble (dissolved) form for the wastewater, most frequently known to vary from 70 to 90 percent.
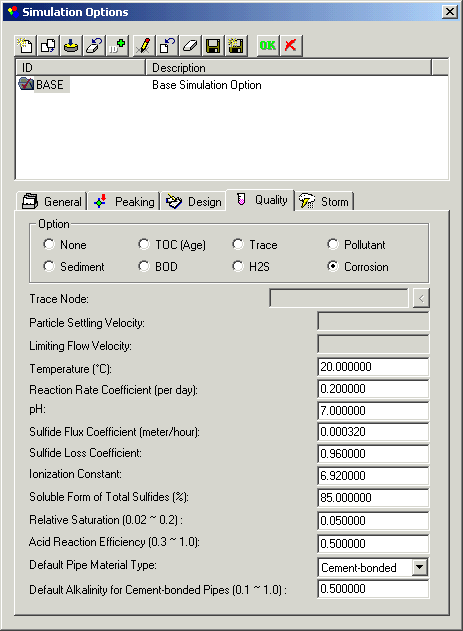
The default values used by the model for these inputs are shown in the following dialog box. In addition to the listed data, the user has to supply initial concentration of total sulfides and ultimate BOD of the wastewater. These two variables could be assigned using the quality tab available at the top of the attribute browser, for one source node at a time, or using the " Group Edit on Domain" feature that enables simultaneous assignment of the two variables for all source nodes in the domain.
Corrosion
Corrosion in sewers causes large annual capital expenditures. Corroded sewer pipes may allow greater inflow and infiltration into the collection system causing surcharges and overflows, ultimately calling for premature replacement of sewer pipes. Corrosion of unprotected concrete or metal surfaces is primarily due to the production of sulfuric acid in sewer systems through oxidation of hydrogen sulfide gas by bacterial action on the exposed surfaces under aerobic conditions.Corrosion PredictorTM extension for H2OMAP Sewer suite helps wastewater engineers to predict the rate of corrosion of the sewer pipes in their collection systems under varying environmental and hydraulic conditions enabling them to pinpoint pipes that are subjected to severe corrosion problems.
The rate of pipe corrosion depends upon the rate of sulfuric acid production, the amount of the produced sulfuric acid that reacts with the pipe material, and the alkalinity of the pipe material. Sulfuric acid production is related to the amount of hydrogen sulfide gas that escapes to the sewer atmosphere, which in turn depends on a number of environmental and hydraulic conditions previously described in relation to hydrogen sulfide buildup, partitioning, and release. Corrosion PredictorTM determines rate of corrosion for cementitious (cement-bonded) materials and ferrous materials in gravity sewers using Pomeroy equation. In force mains, where the lines flow full, there is generally no internal corrosion since generation of sulfuric acid is prevented.
Some of the parameters required during prediction of corrosion rates are shown in the following dialog box.
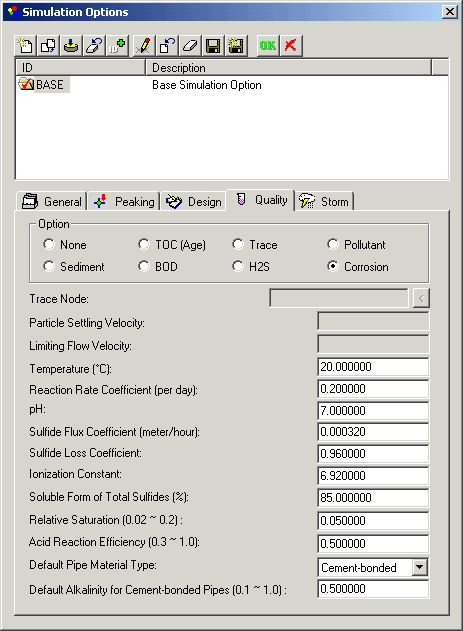
In order to predict rate of corrosion in sewer systems using Corrosion PredictorTM , one has to first model the build up, partitioning, and emission of hydrogen sulfide. Therefore, all the data listed and described above in relation to hydrogen sulfide modeling is essential for predicting corrosion rate in sewer systems. This data include
· initial concentration of total sulfides at source manholes.
· ultimate BOD of the wastewater for every source node.
· average daily temperature for the region (in oC).
· reaction rate coefficient (per day) which was described above in relation to BOD modeling.
· pH of the wastewater. The normal pH range of municipal wastewater is 6.0 to 8.0.
· effective sulfide flux coefficient for sulfide generation by the slime layer in gravity sewers (meter/hour). For conservative analysis (i.e., observed sulfide buildup generally less than predicted), the suggested values of this parameter is 0.00032.
· a dimensionless coefficient to account for sulfide losses by oxidation and escape to atmosphere. For conservative analysis (i.e., observed sulfide buildup generally less than predicted), the suggested values of this parameter is 0.64. For moderately conservative analysis a value of 0.96 is suggested.
· logarithmic ionization constant for hydrogen sulfide (unit less), a function of temperature and specific electrical conductance of the waste water. Its value generally varies from 6.67 (at a temperature of 40oC and specific electrical conductance of 50, 000 micromhos/cm) to 7.74 (at a temperature of 10oC and specific electrical conductance of 0 micromhos/cm).
· percent of total sulfides that occur in the soluble (dissolved) form for the wastewater, most frequently known to vary from 70 to 90 percent.
Note:Since corrosion is a result of long term environmental effects, the above described data ( e.g. temperature, ultimate BOD, initial concentration of total sulfides, pH, etc ) should be assigned accounting for their seasonal fluctuations.
Initial concentration of total sulfides and ultimate BOD of the wastewater for every source node could be supplied using the quality tab (![]() ) located at the top of the attribute browser, or using the group editing features (i.e., group editing on selection (
) located at the top of the attribute browser, or using the group editing features (i.e., group editing on selection (![]() ) and group editing on domain (
) and group editing on domain (![]() )) for a group of source nodes simultaneously.
)) for a group of source nodes simultaneously.
In addition to the above described inputs, corrosion prediction requires specification of the following data.
· pipe material ( i.e., cement-bonded or ferrous) for gravity pipes.
· alkalinity of the pipe material expressed as CaCO3 equivalents (for cement-bonded materials only). This value approximately ranges from 0.18 to 0.23 for granitic aggregate concrete, 0.9 for calcareous aggregate, 0.4 for mortar linings, and 0.5 for asbestos cement.
· coefficient of efficiency for acid reaction considering the estimated fraction of acid remaining on the wall. This value could be as low as 0.3 and will approach 1.0 for a complete acid reaction.
· relative saturation of H2S in the air compared to equilibrium concentration (typically 2 to 20 percent), expressed as decimal fraction.
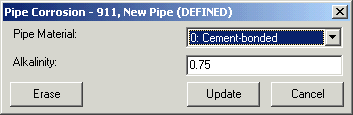
Pipe material type and the associated alkalinity could be specified for one pipe at a time using the corrosion tab (![]() ) located at the top corner of the attribute browser. To use this option, select the pipe, click on the corrosion tab, and then specify the material type and the alkalinity (for cement-bonded materials only) on the initialed dialog box (shown below).
) located at the top corner of the attribute browser. To use this option, select the pipe, click on the corrosion tab, and then specify the material type and the alkalinity (for cement-bonded materials only) on the initialed dialog box (shown below).
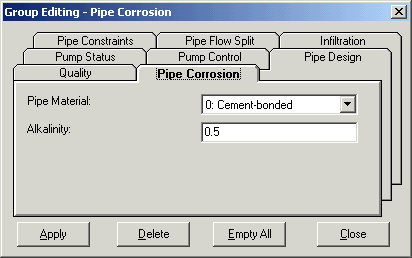
These two input data could also be specified for a group of pipes simultaneously using either of the group editing features (i.e., group editing on selection (![]() ) and group editing on domain (
) and group editing on domain (![]() )). To use the group editing on domain feature, for example, one has to first create a domain. Once domain is created, the
)). To use the group editing on domain feature, for example, one has to first create a domain. Once domain is created, the ![]() icon should be clicked. This process initiates the group editing dialog box. On this dialog box, click on the "pipe Corrosion" option, and then specify the material type and the alkalinity (for cement-bonded materials only), as shown below.
icon should be clicked. This process initiates the group editing dialog box. On this dialog box, click on the "pipe Corrosion" option, and then specify the material type and the alkalinity (for cement-bonded materials only), as shown below.
The default values used by the Corrosion PredictorTM for pipe material, alkalinity of pipes made from cement-bonded materials, coefficient of acid reaction efficiency, and the relative saturation of H2S are: cement-bonded, 0.5, 0.5, and 0.05, respectively.
Note: The model uses the default material type and the default alkalinity for all gravity pipes in the system for which material type and alkalinity are not specified.