Work Flow for #InfoSWMM Sustain
The major tasks in using InfoSWMM Sustain are the following:
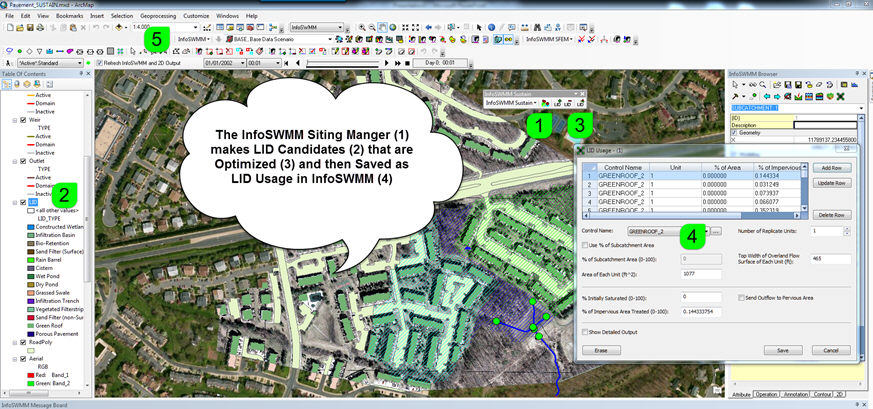
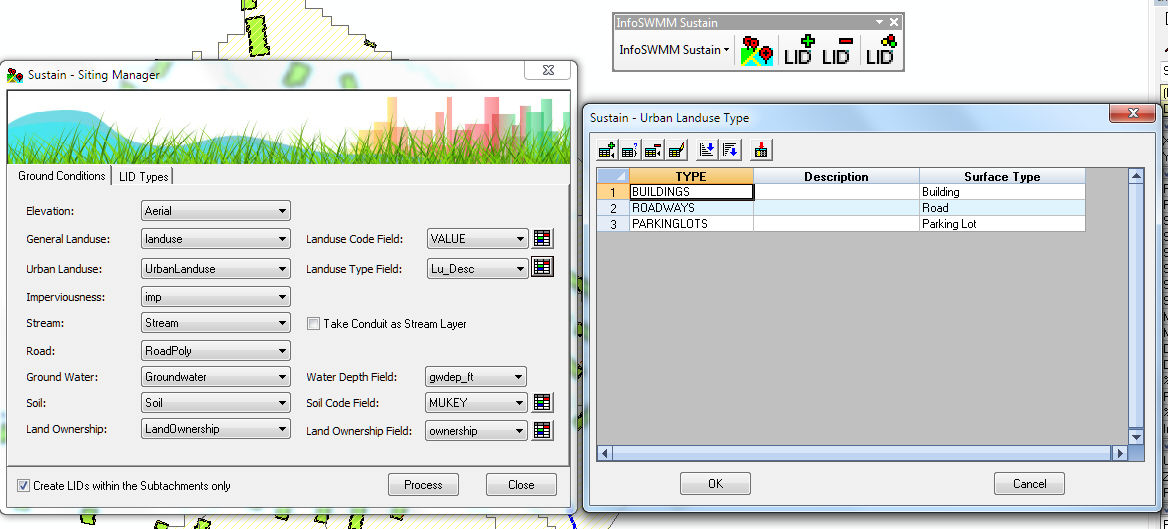
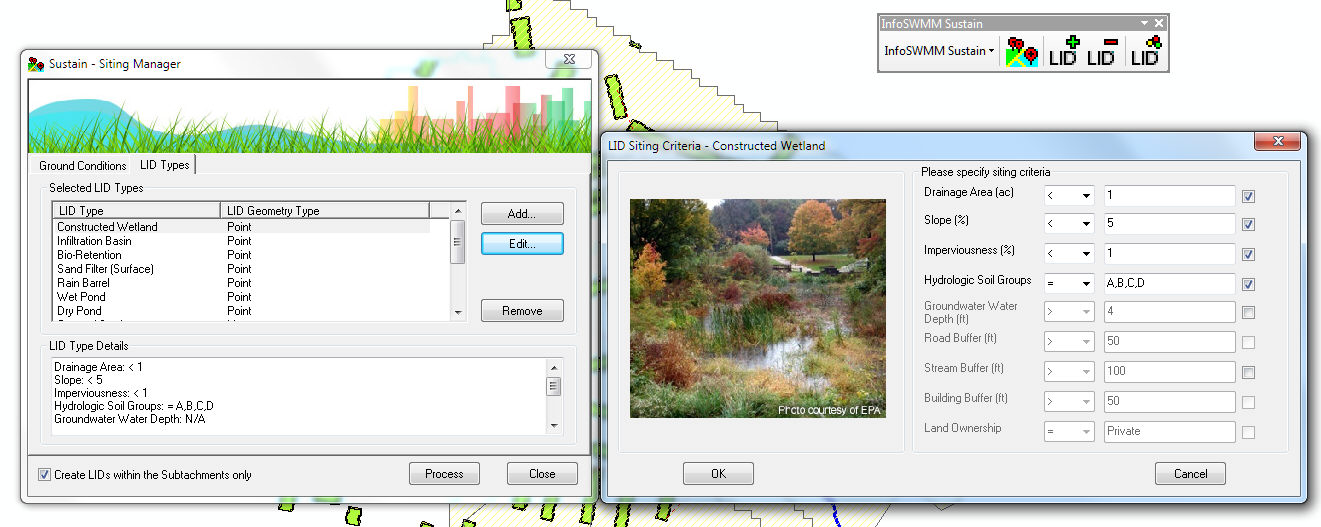
- Use the Siting Manager to Add New LID's based on GIS Rules as set up in the Ground Conditions Dialog or Import from InfoSWMM
- Run the Optimizer tool to select LID Candidates for Optimization
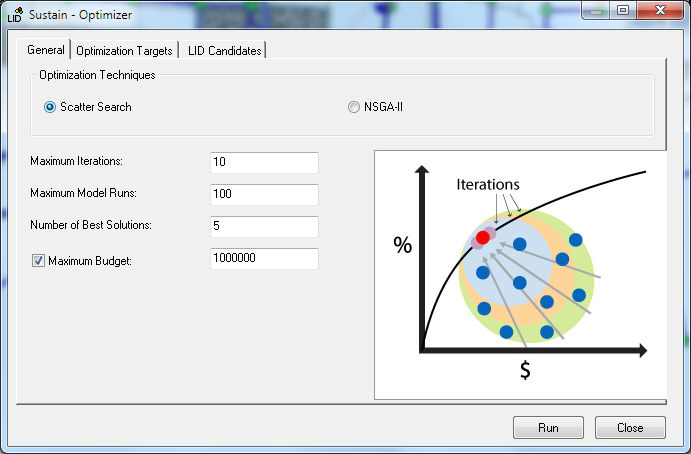
- Optimize or find the Best Solutions using Scatter Search or the Optimal Cost Solution using GA
- Review the Design Report, Performance Report and
- Review the Cost Effectiveness Curve
- Decide which of the Designs will be applied to InfoSWMM
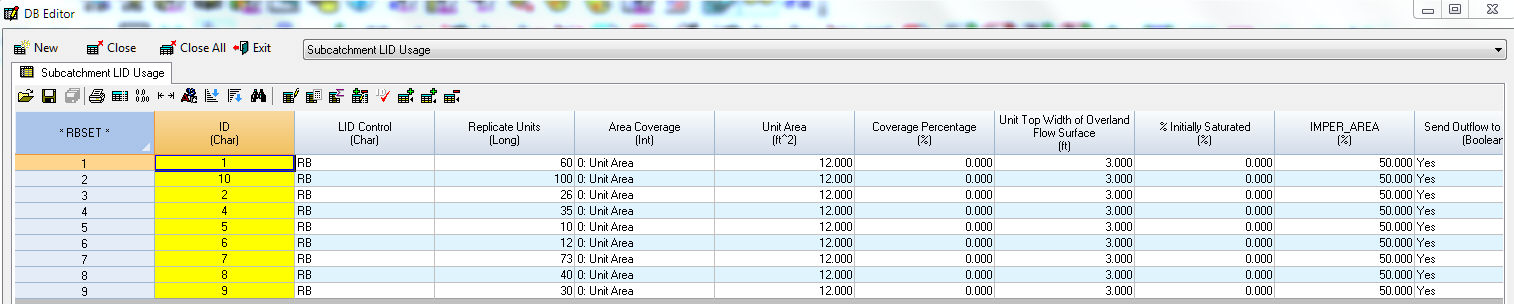
- Use the LID Usage Table exported from Sustain in your InfoSWMM model (Base or Scenario)

 The major tasks in using InfoSWMM Sustain.
Set up the ground conditions in the Siting Manager.
Add LID Types to the LID Candidates Pool using the Siting Manager.
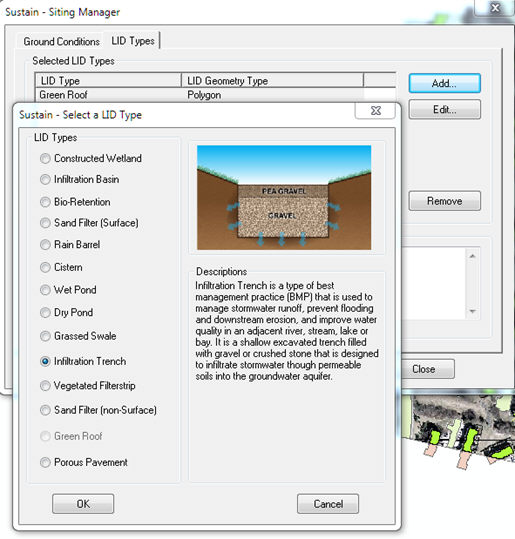
Process the LID Types to the Pool of LID Candidates
Setup the Optimization Rules and Choose the Final LID Candidates for Optimization.
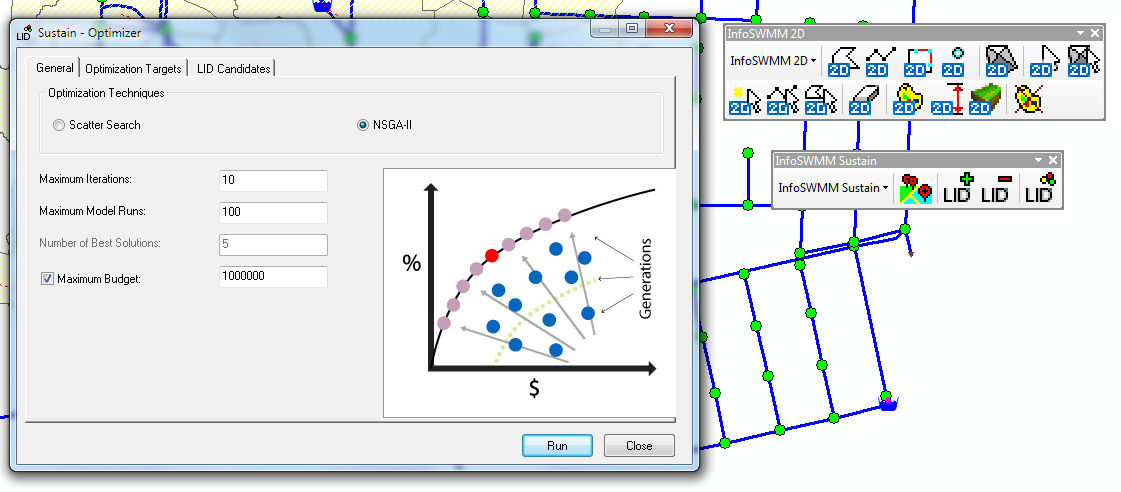
Note: Scatter Search is for the best solution finding and NSGA-II GA is for cost effective curve generation.
Maximum budget is the maximum amount allowed to be spent on the run.
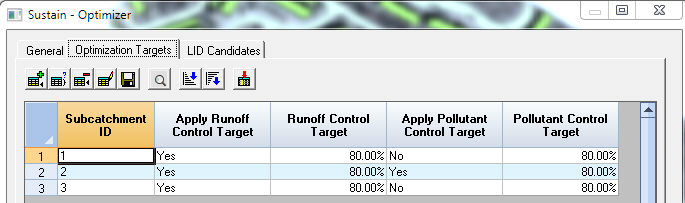
Setup or choose the Optimization Targets.
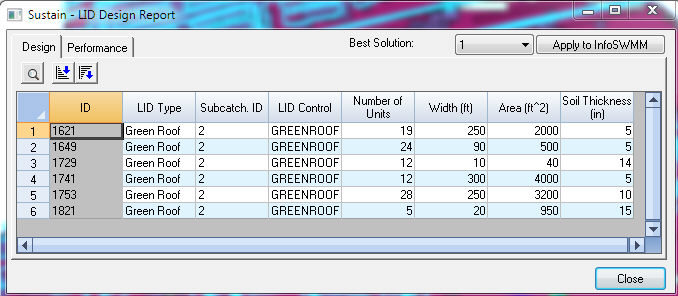
Review the Design Report after Optimization.
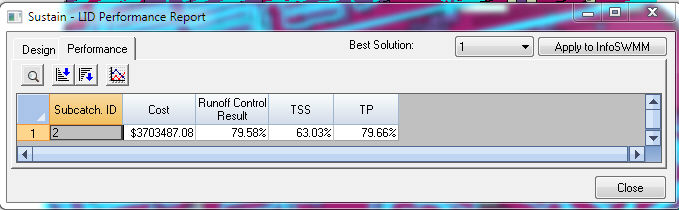
Review the Performance Report after Optimization.
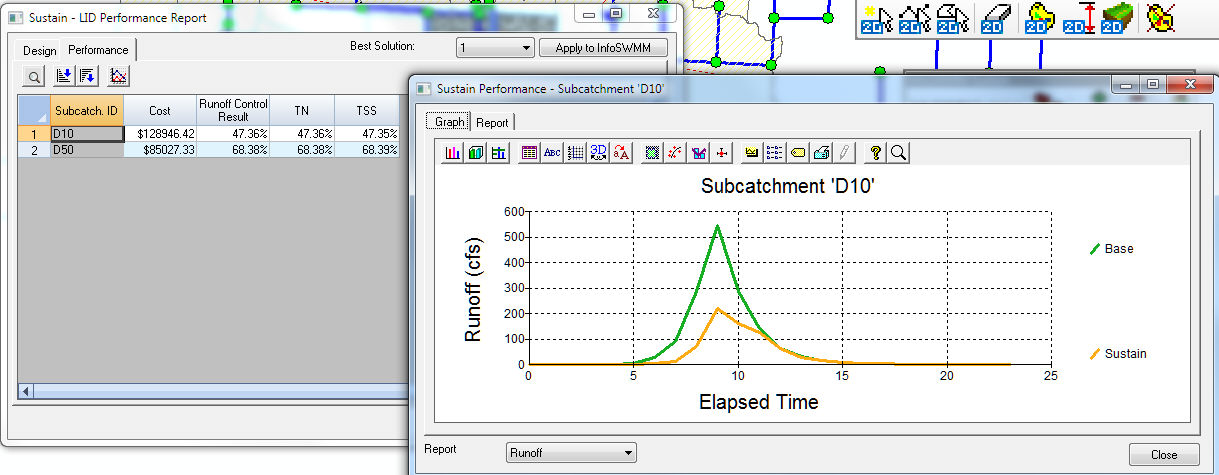
Graph the Sustain Performance.
Review the Cost Effectiveness Curve

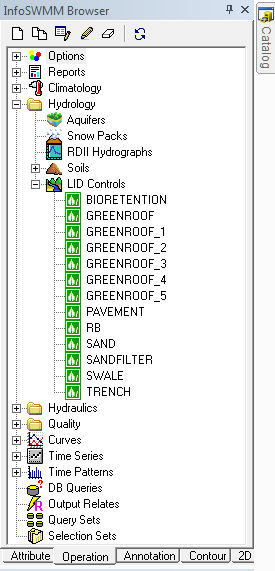
 Export the data back to InfoSWMM to the LID Controls and LID Usage Table
Very important to your model is the percent impervious capture and the total coverage of LID's on your runoff surfaces - see the LID Summary report for these key parameters
Tutorial 10 LID Coverage In the Output File
Three important effectiveness options are:
- Percent Imperviousness captured
- Is the outlet of the LID Control the Pervious Area or the Subcatchment Outlet (the Treatment Train)
- The percent coverage of the LID over the Subcatchment (Cost)
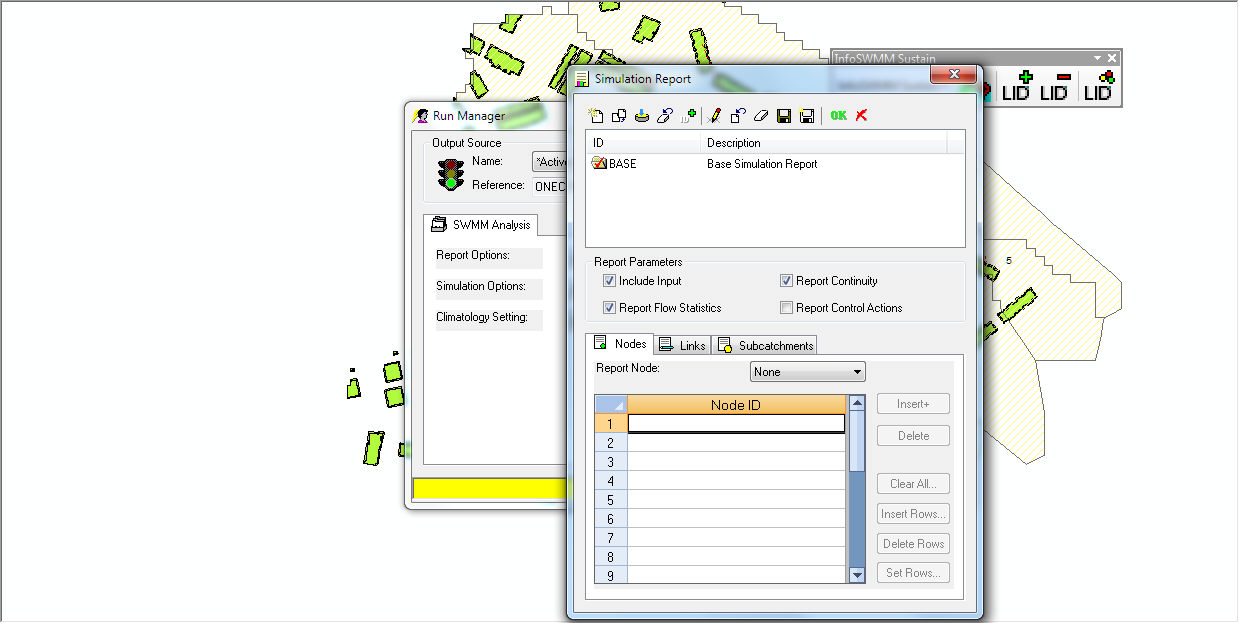
You can see these parameters in the RPT file output by viewing the Notepad Report icon.
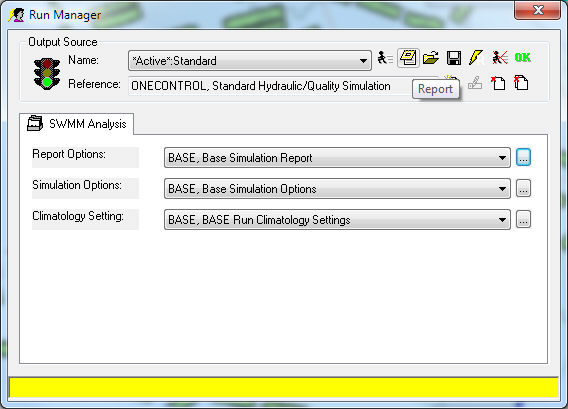
The report file is generated with the input parameters if you choose Include Input in the simulation report options.
The LID Control Summary Table shows the Number of Units, Area covered and Impervious coverage percentage.
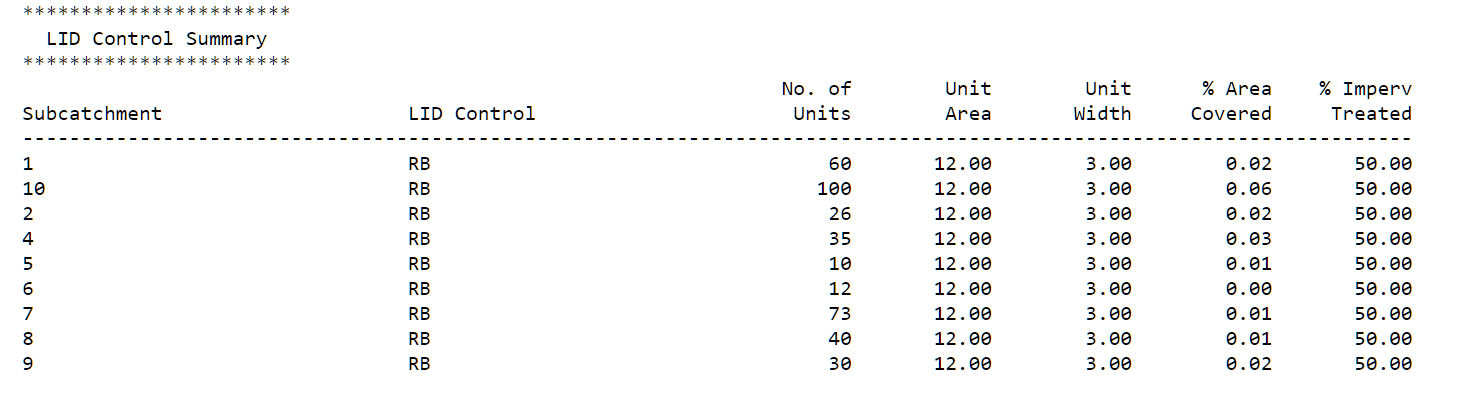
The LID Summary Table reflects the LID Usage with Summary columns.