Step 5. Determine the Dry Days, Groundwater Flow and DWF Patterns
To decompose the flow monitoring data into dry weather flows and wet weather flows, RDII Analyst first identifies the dry days based on user specified criteria.
1. Launch the DWF Extraction dialog by clicking ( ![]() ) from the toolbar or from the menu select Analysis -> Extract DWF.
) from the toolbar or from the menu select Analysis -> Extract DWF.

[
2. Specify the values shown above for the Minimum Rainfall Depth Threshold, Number of Days and the Standard Deviation Multiplier and click the![]() button.
button.
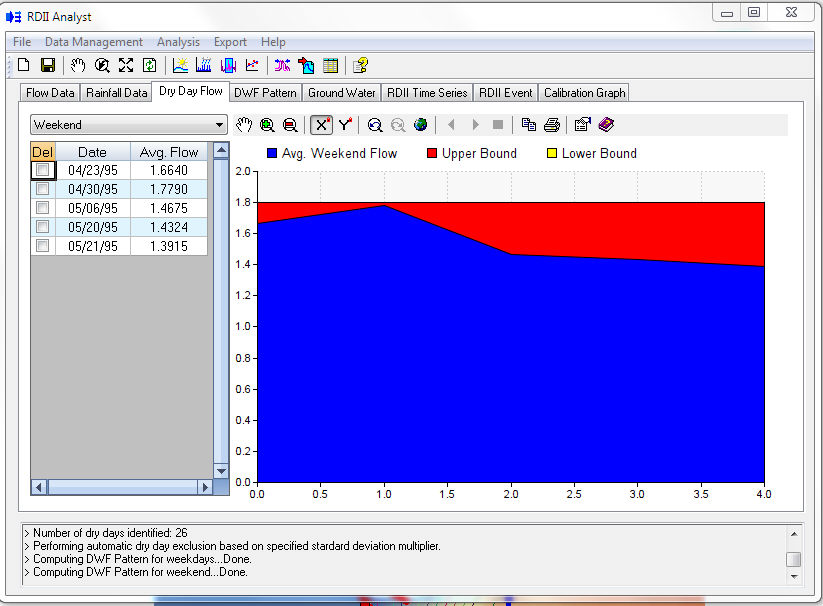
3. The days that satisfy the dry day criteria specified above would be extracted from the flow monitoring data and would be reported along with average daily flow. In addition, mean daily flow and standard deviation of the identified dry days is calculated and the upper bound and the lower bound lines would be given in graph form. The upper bound line refers to the mean daily flow of the dry days plus Standard Deviation Multiplier* standard deviation of the dry day flows. The lower bound line refers to the mean daily flow of the dry days minus Standard Deviation Multiplier* standard deviation of the dry day flows. If average daily flow for one or more of the dry days is outside the upper bound and the lower bound range, it is likely that the day is an outlier and may have to be discarded from the dry days list and should not be considered for further analysis.
Weekday Pattern

4. The outliers may be deleted manually or automatically. If you wish to delete the outliers automatically, you need to select the Automatically Validated Dry Days option and re-run the DWF extraction. To delete the outliers manually, select the outlier data rows with average daily flows outside the bounds as shown below. Click Delete at the top of the first column on the report and then click the Save Button ( ![]() ), and click Yes at the confirmation message.
), and click Yes at the confirmation message.
Weekend Pattern

5. Once the outliers are removed you should get the average dry day flow time series shown below.
6. RDII Analyst can also estimate the groundwater flow contribution to the wastewater flow. Select the Extract Groundwater Flow option on the DWF Extraction dialog and specify 0.5 for the Fraction of the minimum weekly flow contributed by GWI parameter. The groundwater flow is estimated as a multiple of the minimum weekly flows observed from the dry days. The minimum weekly flows can be rescaled by this user specified multiplier.
7. Review the extracted groundwater time series. It has 52 values, one value for each week of the year.
8. Once the dry days are identified, RDII Analyst automatically calculates hourly DWF patterns for weekends and weekdays and presents them both graphically and in report form. To view the hourly DWF patterns, click the DWF Pattern tab from the graphs and reports list.

9. You can see the DWF Pattern if you run InfoSWMM H2OMap SWMM InfoSWMM SA and graph the Lateral Inflow at the Nodes.

Privileged and Confidential Communication: This electronic mail communication and any documents included hereto may contain confidential and privileged material for the sole use of the intended recipient(s) named above. If you are not the intended recipient (or authorized to receive for the recipient) of this message, any review, use, distribution or disclosure by you or others is strictly prohibited. Please contact the sender by reply email and delete and/or destroy the accompanying message.