Tutorial 2 Optimizing Rain Barrels for InfoSWMM Sustain
This example shows the importance of a treatment train, the percent imperious draining to the LID's on a Subcatchment, the importance of optimizing for the number of units, area and soil thickness. Sustain will optimize the number of Rain Barrels on the ten Subcatchments.
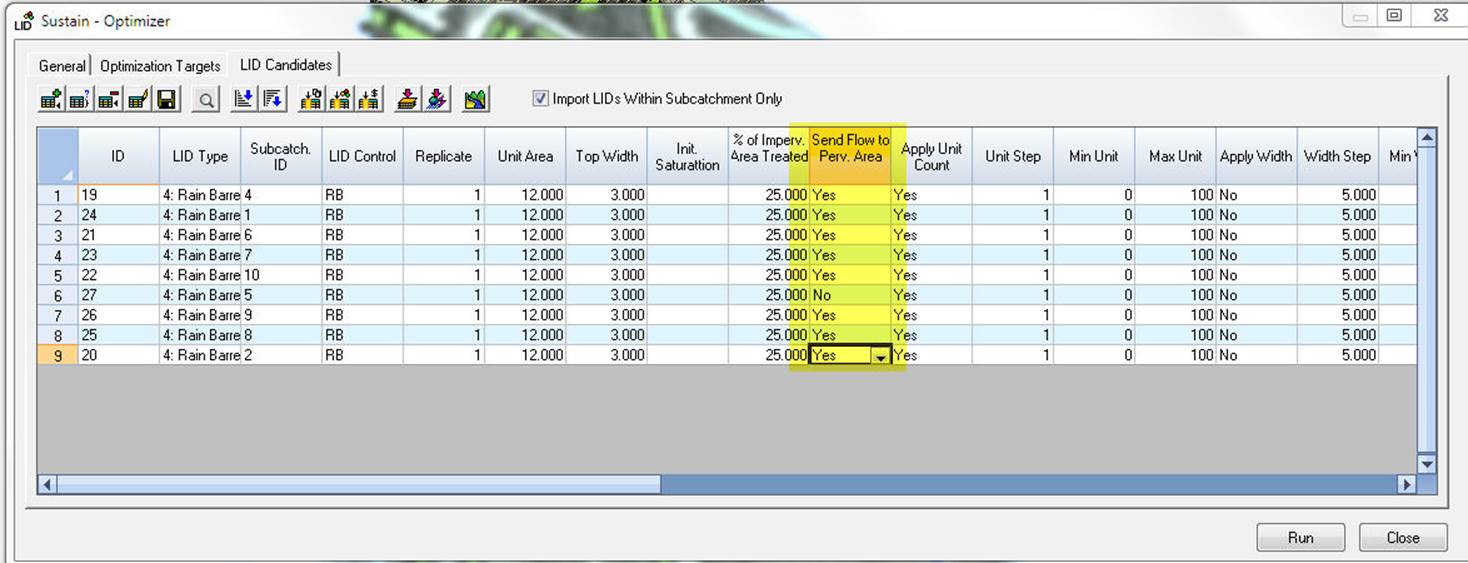
1. Turn off Width and Thickness on the LID Candidates Grid
2. Allow the number of Units to increase
3. Do NOT send the drainage of the Rain Barrels to the pervious area - no treatment train
4. Allow most of the Rooftop drainage to flow into the Rain Barrels
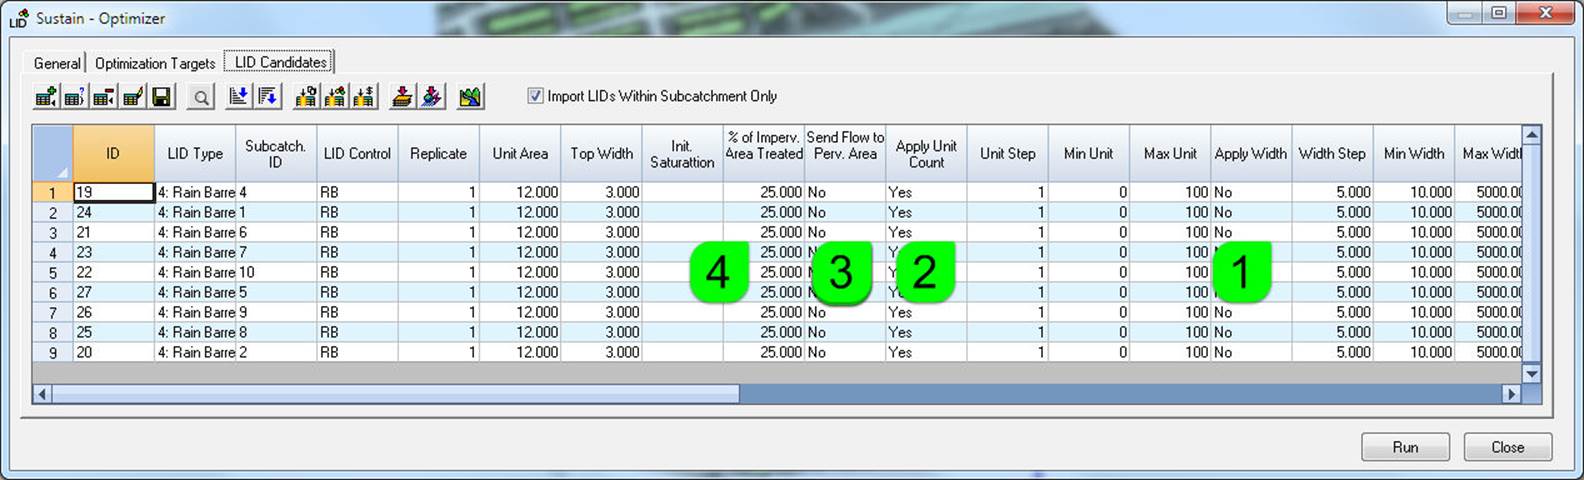
A Data Copy of the Grid
19 4: Rain Barrel 4 RB 1 12.000 3.000 25.000 No No Yes 1 0 100 No 5.000 10.000 5000.000 No 1.000 1.000 25.000 No 1.000 1.000 28639.805 1.000 1.000 1.000 1.000 1.000 50.000 20.000 1.000 1.000 1.000 1.000 1.000
24 4: Rain Barrel 1 RB 1 12.000 3.000 25.000 No No Yes 1 0 100 No 5.000 10.000 5000.000 No 1.000 1.000 25.000 No 1.000 1.000 28639.805 1.000 1.000 1.000 1.000 1.000 50.000 20.000 1.000 1.000 1.000 1.000 1.000
21 4: Rain Barrel 6 RB 1 12.000 3.000 25.000 No No Yes 1 0 100 No 5.000 10.000 5000.000 No 1.000 1.000 25.000 No 1.000 1.000 28639.805 1.000 1.000 1.000 1.000 1.000 50.000 20.000 1.000 1.000 1.000 1.000 1.000
23 4: Rain Barrel 7 RB 1 12.000 3.000 25.000 No No Yes 1 0 100 No 5.000 10.000 5000.000 No 1.000 1.000 25.000 No 1.000 1.000 28639.805 1.000 1.000 1.000 1.000 1.000 50.000 20.000 1.000 1.000 1.000 1.000 1.000
22 4: Rain Barrel 10 RB 1 12.000 3.000 25.000 No No Yes 1 0 100 No 5.000 10.000 5000.000 No 1.000 1.000 25.000 No 1.000 1.000 28639.805 1.000 1.000 1.000 1.000 1.000 50.000 20.000 1.000 1.000 1.000 1.000 1.000
27 4: Rain Barrel 5 RB 1 12.000 3.000 25.000 No No Yes 1 0 100 No 5.000 10.000 5000.000 No 1.000 1.000 25.000 No 1.000 1.000 28639.805 1.000 1.000 1.000 1.000 1.000 50.000 20.000 1.000 1.000 1.000 1.000 1.000
26 4: Rain Barrel 9 RB 1 12.000 3.000 25.000 No No Yes 1 0 100 No 5.000 10.000 5000.000 No 1.000 1.000 25.000 No 1.000 1.000 28639.805 1.000 1.000 1.000 1.000 1.000 50.000 20.000 1.000 1.000 1.000 1.000 1.000
25 4: Rain Barrel 8 RB 1 12.000 3.000 25.000 No No Yes 1 0 100 No 5.000 10.000 5000.000 No 1.000 1.000 25.000 No 1.000 1.000 28639.805 1.000 1.000 1.000 1.000 1.000 50.000 20.000 1.000 1.000 1.000 1.000 1.000
20 4: Rain Barrel 2 RB 1 12.000 3.000 25.000 No No Yes 1 0 100 No 5.000 10.000 5000.000 No 1.000 1.000 25.000 No 1.000 1.000 28639.805 1.000 1.000 1.000 1.000 1.000 50.000 20.000 1.000 1.000 1.000 1.000 1.000
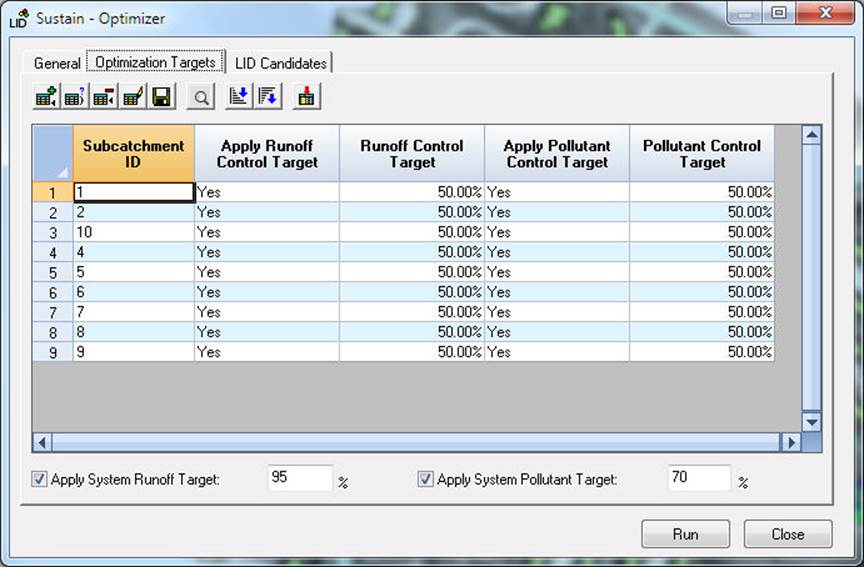
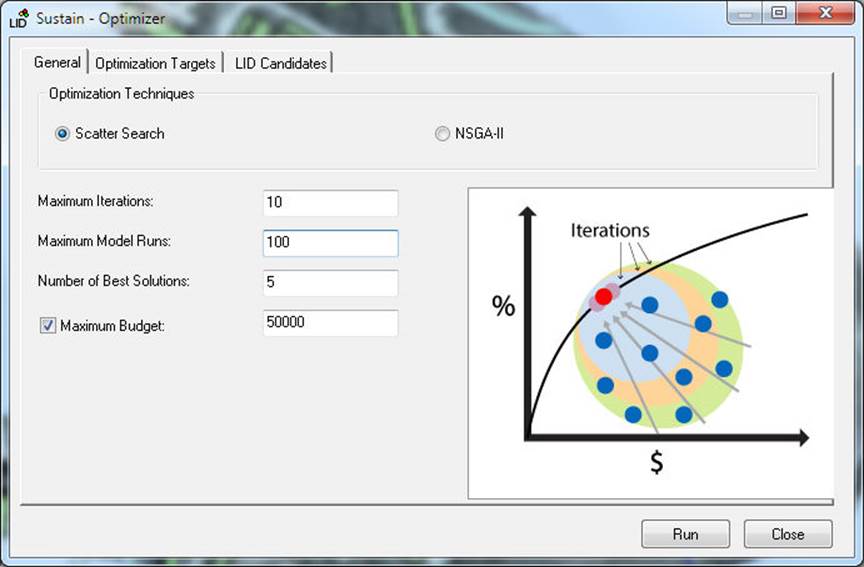
Our Optimization Goals
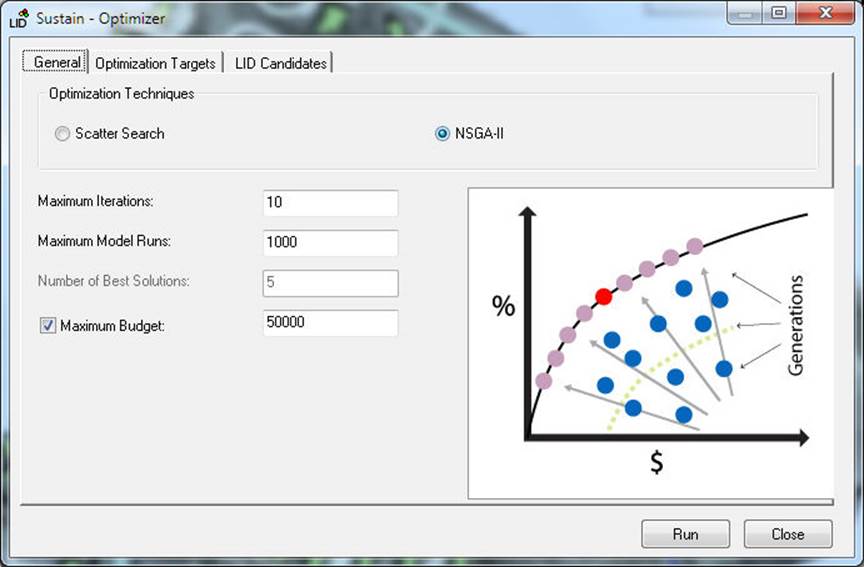
Use NSGA-II Optimization to find the Cost Boundary Curve
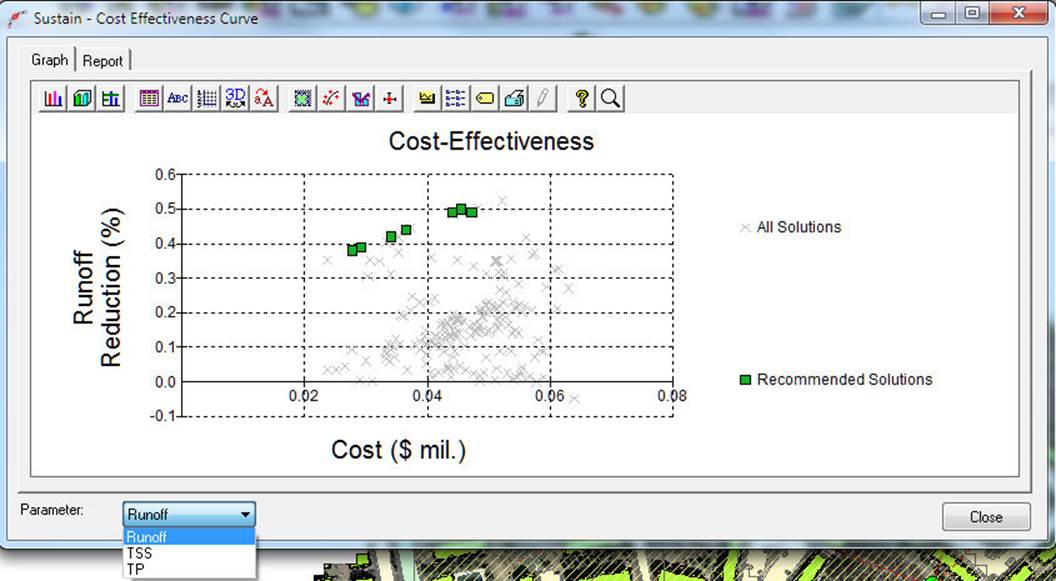
The Cost Effectiveness Curves for Runoff and Water Quality
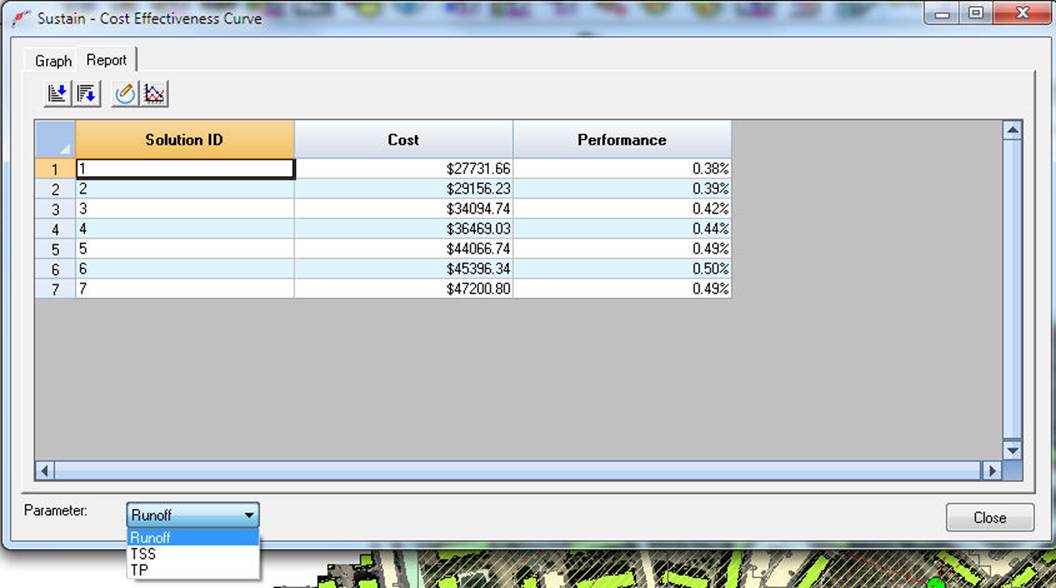
The Cost Effectiveness Report for Runoff and Water Quality
There is little removal as the Rain Barrels are not sending the overflow to the pervious area and there is little storage in a Rain Barrel.
Use Scatter Search to Find the Best Solutions
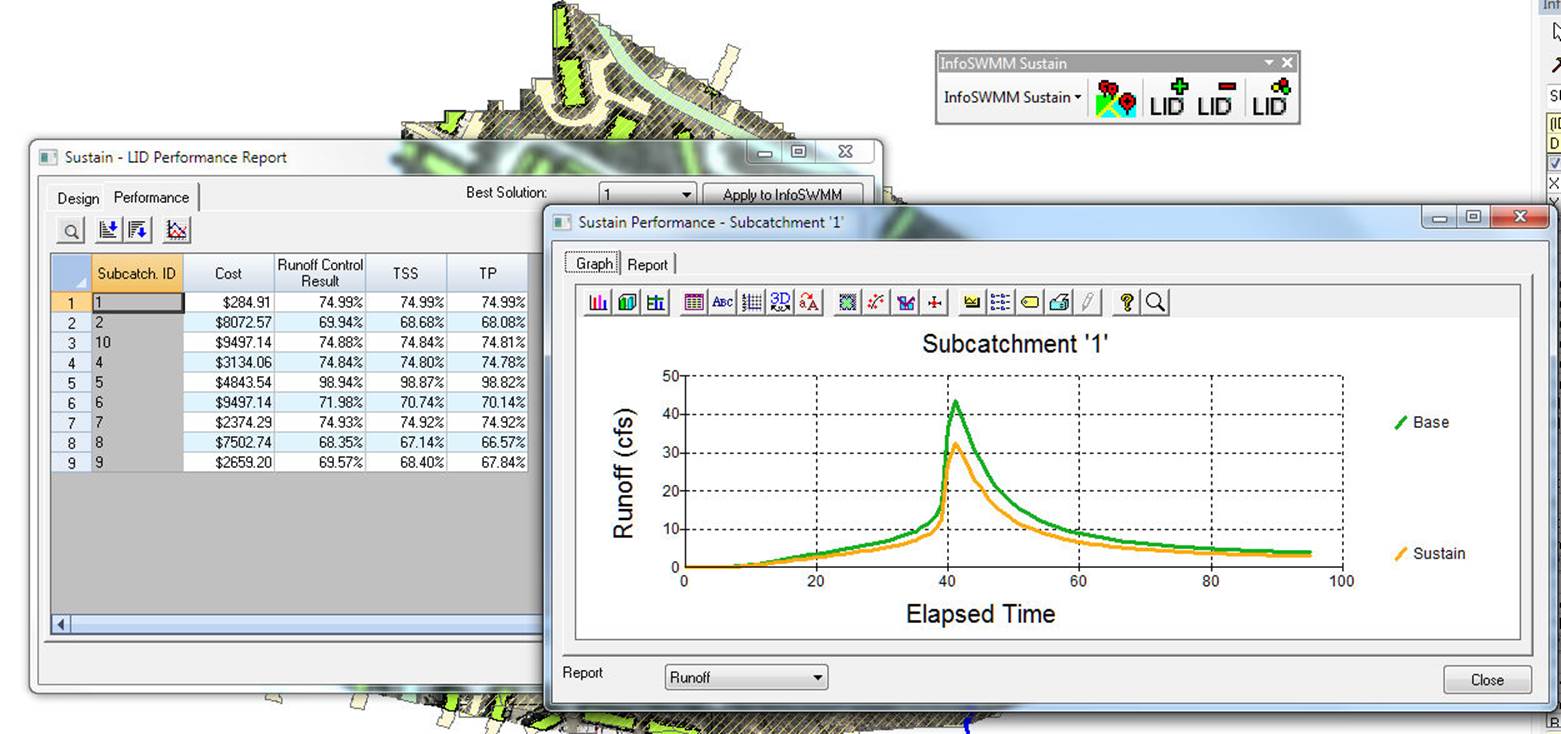
The Design Report and Performance Curve
The lack of a treatment train reduces the impact of the Rain Barrels


Add a Treatment Train by allowing the Rain Barrels to flow onto the Pervious Area of the Subcatchments
The Design Report and Performance Curve
The treatment train improves the impact of the Rain Barrels
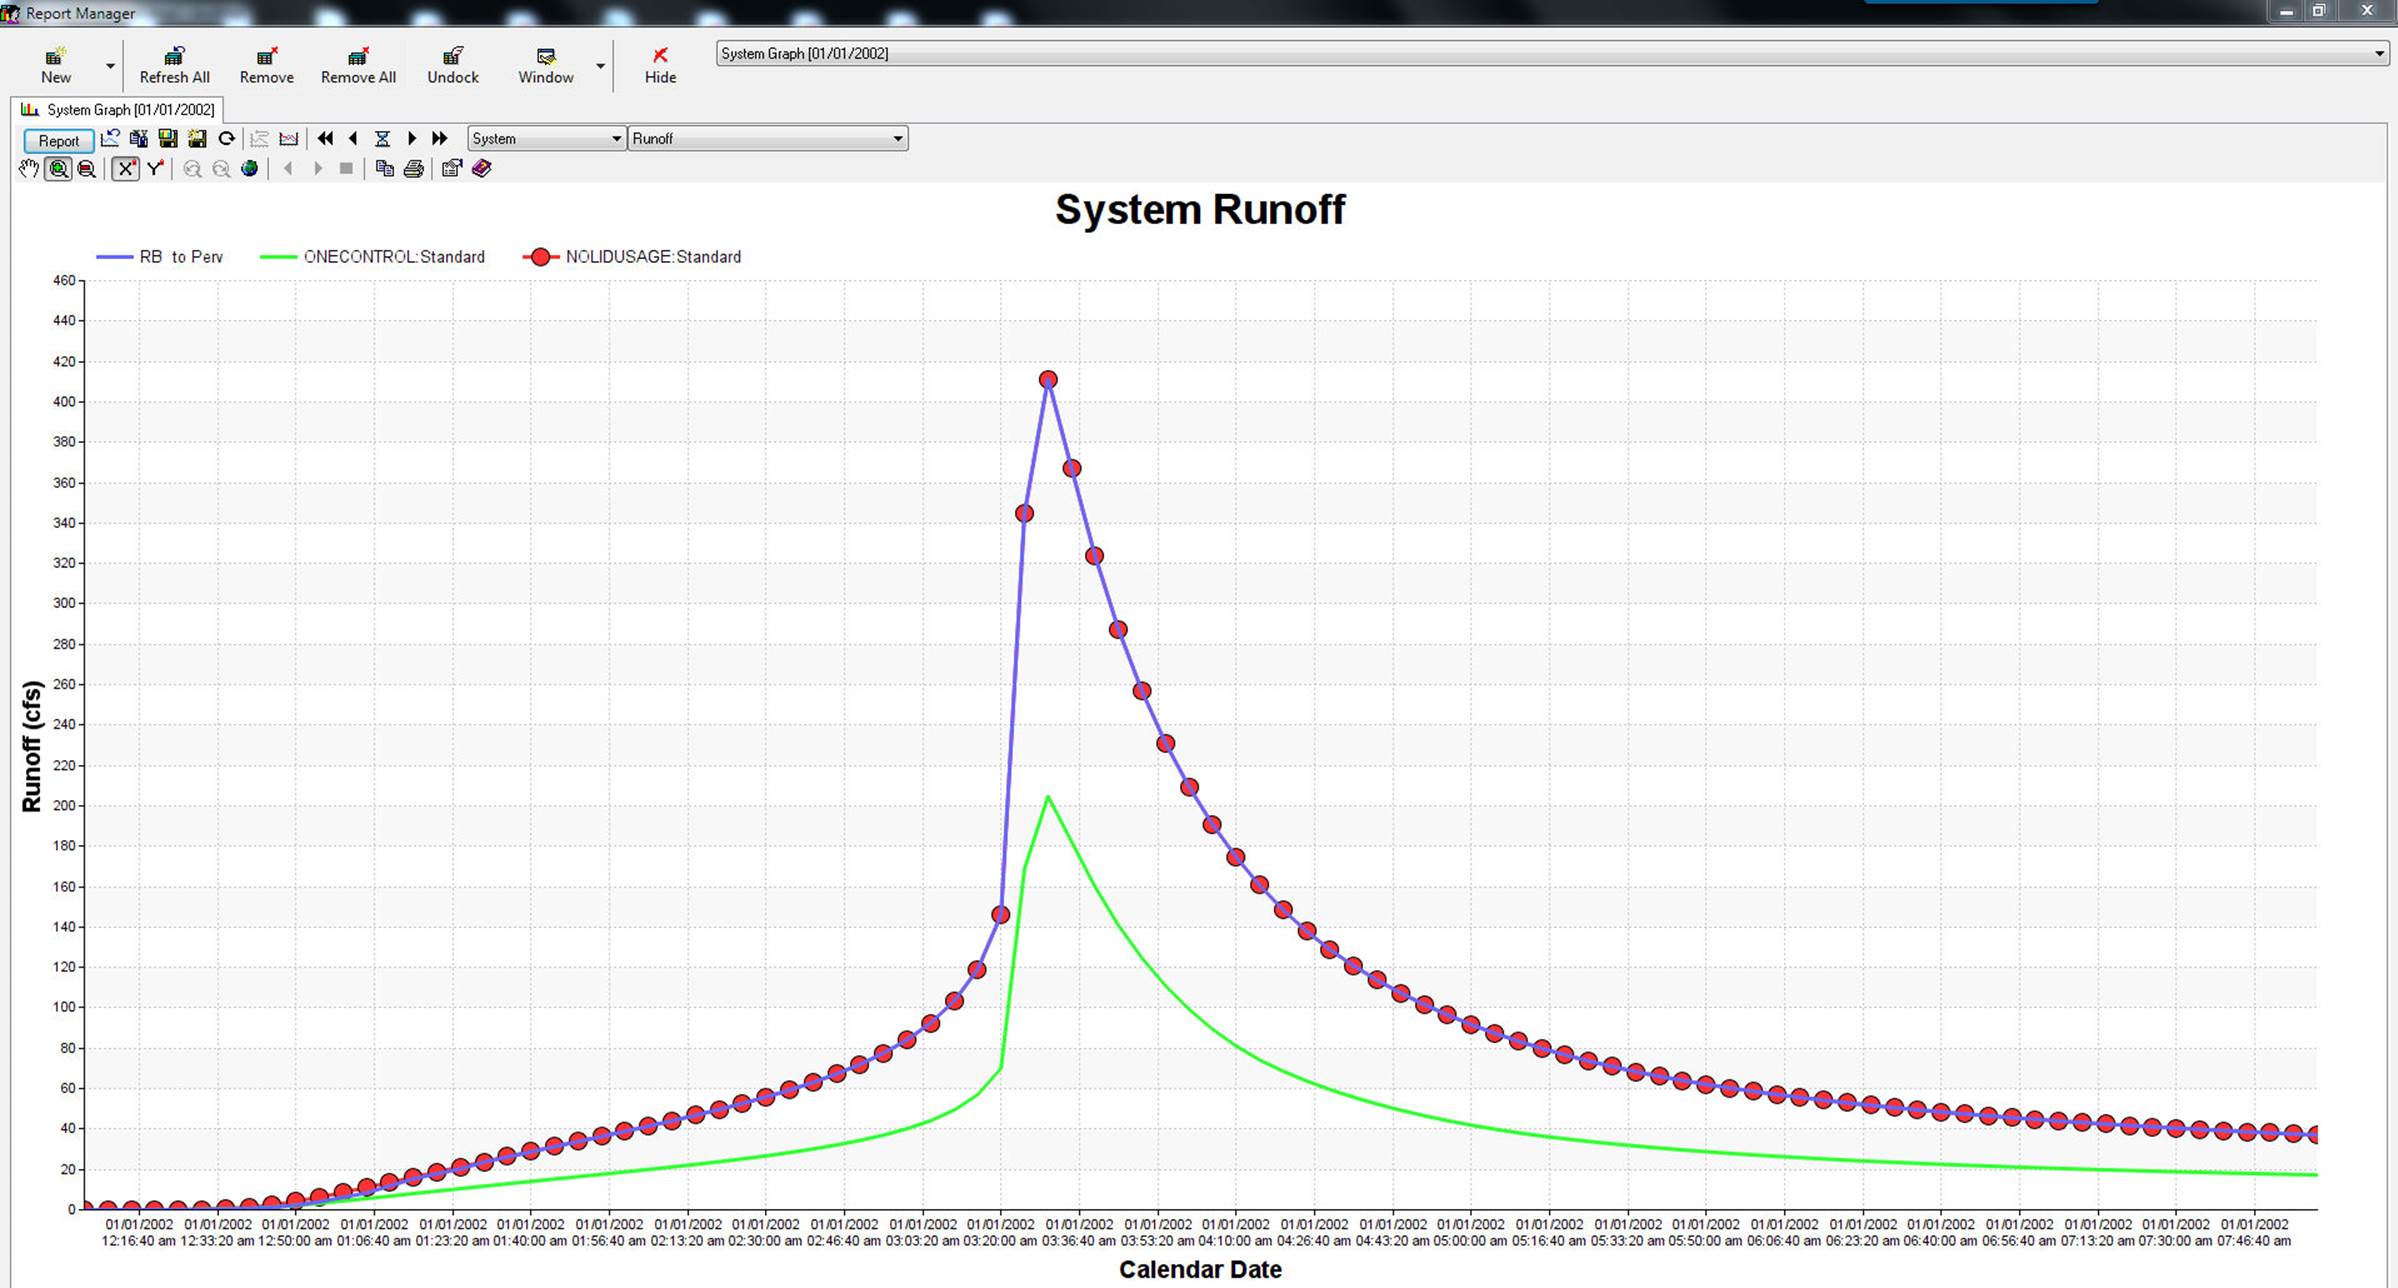
The Effect of the Treatment Train in InfoSWMM
If you export the optimized LID's to InfoSWMM (LID Usage DB Table) then you can see the effect of sending the flow to the pervious area from the Rain Barrels. The Red Dot Scenario is the Rain Barrels NOT flowing to pervious area but the outlet of the Subcatchment. The Green line is the Rain Barrel flowing to the pervious area. See also Tutorial 10.