2.5 Decomposing the Corrected Flow Data
The corrected flow data can be decomposed into its DWF, GWI, and RDII flow components with the help of the rainfall data. The decomposition process is illustrated in this section.
Determining the DWF Component
The first step towards determining the DWF component of the flow data is to identify dry days and wet days. The objective is to extract dry days (i.e., days not affected by precipitation) from the flow data, and to perform DWF analysis on these dry day flows. A day is defined as a dry day if the total depth of rainfall for the last user defined number of days is less than a given threshold. The presumption is that if there is no rain for extended number of days, the measured flow data represents the DWF component and the GWI component, but not the RDII flow component. The DWF component identified using this criterion can be further analyzed and verified manually or guided by statistical tools available from RDII Analyst.
The DWF Extraction inputs are specified on the DWF Extraction dialog editor shown below. The editor can be launched either from Analysis Menu -> DWF Extraction or from DWF Extraction tool (  ).
).

Minimum Rainfall Depth Threshold: refers to the cumulative volume of rain that should not be achieved or exceeded over the last N Number of Days for a day to be defined as a dry day, otherwise the day is defined as a wet day.
Standard Deviation Multiplier -Days categorized as dry days based on Minimum Rainfall Depth Threshold and Number of Days (N) criteria may be further verified guided by statistical parameters such as the mean and the standard deviation of flow values for the identified dry days. If flow value for dry day X is less than mean minus standard deviation multiplier* the standard deviation or higher than mean + standard deviation multiplier* the standard deviation, then that flow value may be an outlier (i.e., it may not be a representative dry day value). If that happens, the user has the option to discard the day from the dry day list. If the Automatically Validate Dry Days option is checked, then the program automatically discards dry days that meet the criterion. Otherwise, the user can manually delete dry days that are outliers.
Once determined, the dry days flows are presented both in report form and in graph form for weekend and for weekdays as shown below. The graph shows average daily flow for each dry day, and upper bound and the lower bounds. The upper bound refers to mean flow of all dry day flows plus standard deviation multiplier *standard deviation of dry day flows. The lower bound refers to mean flow of all dry day flows minus standard deviation multiplier *standard deviation of dry day flows. The bounds help the user visually identify outliers and, if necessary, discard those days from further consideration.

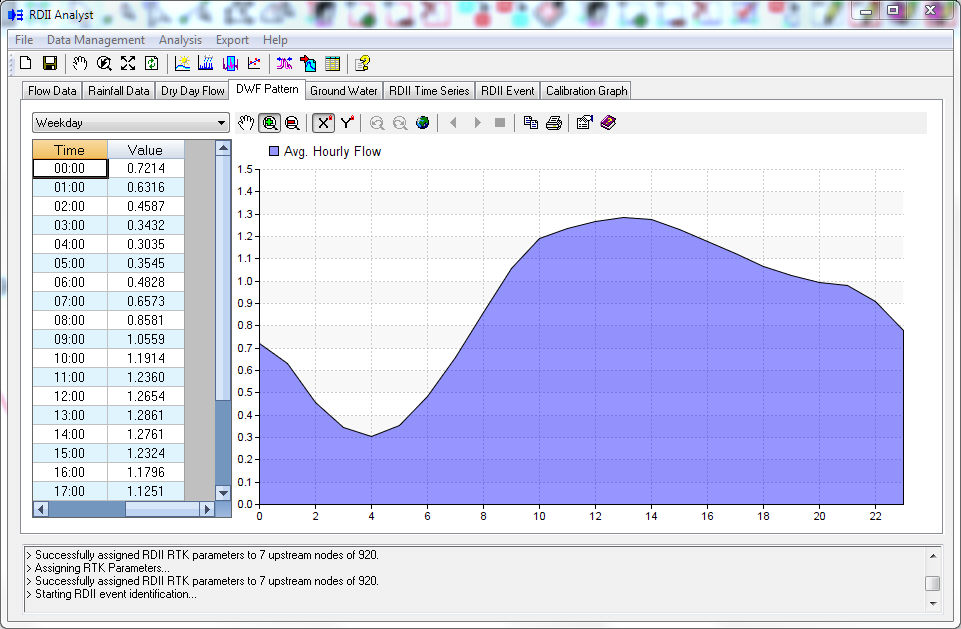
The dry day flows identified for weekdays and the weekend are further analyzed to determine hourly DWF patterns that can be used to model DWF in InfoSWMM H2OMap SWMM InfoSWMM SA. The DWF pattern presents average hourly DWF values across all dry days for both weekdays and weekend. The DWF pattern is given both graphically and in report form as shown below.
The DWF patterns can be exported toInfoSWMM H2OMap SWMM InfoSWMM SA and are assigned to nodes that contribute flow to the meter location proportional to sewershed area or equally among all nodes. Detailed description of how to export DWF patterns and the available options will be described in another section later in this chapter.
Determining the Groundwater Flow Component
In areas where groundwater table is high (i.e., close to ground surface), groundwater flow may enter sewer systems through pipe cracks, through joints or through manhole covers. Groundwater flow to sewer systems may not show significant variability with time. In RDII Analyst, groundwater component is assumed as the minimum weekly flow extracted from the dry days. The minimum weekly dry day flows can be adjusted by a user-defined multiplier that is defined using the DWF Extraction dialog editor previously described. To extract the groundwater flow component, you need to check the Extract Groundwater Flow option and then assign a value for Fraction of the minimum weekly flow contributed by GW.

Fraction of the minimum weekly flow contributed by GWI: This multiplier adjusts the weekly minimum flows extracted from the dry day flows. The product of this multiplier and the minimum weekly flows would be reported as groundwater flow contribution. Once the analysis is complete, GWI component is presented graphically and in report form as shown below.

The groundwater flow time series can be exported toInfoSWMM H2OMap SWMM InfoSWMM SA as external inflow and can be assigned to nodes that contribute flow to the meter location proportional to sewershed area or equally among all nodes. Detail description of how to export groundwater flow time series will be described in another section later in this chapter.
Determining the RDII Flow Component
RDII flow is the difference between the corrected monitoring flow data, and the sum of average hourly DWF pattern and the groundwater flow time series. Once the hourly DWF pattern and the groundwater flow components are identified, the sum of the two components would be subtracted from the corrected flow data to determine the RDII flow component. RDII time series evaluation can be launched by clicking the ( ![]() ) button on the toolbar or from the menu using Analysis -> RDII Analysis -> Compute RDII Time Series.
) button on the toolbar or from the menu using Analysis -> RDII Analysis -> Compute RDII Time Series.
Extraneous RDII values can be eliminated by setting the correct parameters in the following dialog:
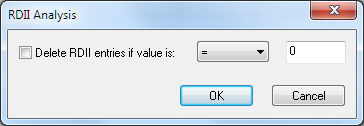
Clicking OK will produce the RDII Time Series:
