Runoff Coefficients
Runoff coefficient is loosely defined as the ratio of runoff to rainfall, and is a function of watershed characteristics including land use, soil type, and slope of the watershed. The value of runoff coefficient ranges between 0.0 and 1.0. A value of 0.0 means that all of the rainfall is lost in the form of abstractions such as infiltration, interception, and evaporation and none of the rainfall is converted to runoff. The value of 1.0 implies that all the rainfall is converted to runoff and is discharged from the watershed. As an example, most of the rain that falls on impervious areas such as pavement and roof would be immediately converted to runoff. A value of C for such land uses is close to 1.0. Runoff coefficient values recommended by the American Society of Civil Engineers and Water Environment Federation for return periods not exceeding 10 years are given below for various land uses, soil types, and slope conditions.
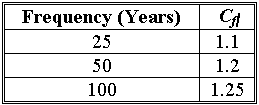
For return periods that exceed 10 years, the runoff coefficient from the table should be multiplied by a frequency adjustment factor, Cf , given below.
For a subwatershed composed of multiple land uses, a composite runoff coefficient Cw should be determined by weighting C values of each of the land uses by their corresponding area according to Equation 35.
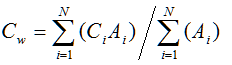
where Ci = runoff coefficient for individual land use in the subwatershed.
Ai = area of the individual land use in the subwatershed.
N = total number of land uses in the subwatershed.
Stormwater Runoff and the Rational Method from Innovyze H2OCalc for Reference
For storm sewer loading, the focus shifts to hydrologic analysis of excess precipitation and associated runoff. Common techniques for analysis include the rational method and unit hydrograph methods, as well as the use of more advanced hydrologic models.
For small drainage areas, peak runoff is commonly estimated by the rational method. This method is based on the principle that the maximum rate of runoff from a drainage basin occurs when all parts of the watershed contribute to flow and that rainfall is distributed uniformly over the catchment area. Since it neglects temporal and spatial variability in rainfall, and ignores flow routing in the watershed, collection system, and any storage facilities, the rational method should be used with caution only for applications where the assumptions of rational method are valid.
Rational Method from Innovyze H2OCalc for Reference
The rational formula is expressed as

where Qp = peak runoff rate (m3/s, ft3/s)
C = dimensionless runoff coefficient (see Table 3-9)
I = average rainfall intensity (mm/hr, in/hr) for a duration of the time of concentration (tc)
A = drainage area (km2, acres)
K = conversion constant (0.28 in SI, 1 in English)
The time of concentration tc used in the rational method is the time associated with the peak runoff from the watershed to the point of interest. Runoff from a watershed usually reaches a peak at the time when the entire watershed is contributing; in this case, the time of concentration is the time for a drop of water to flow from the remotest point in the watershed to the point of interest. Time of concentration, tc (min), for the basin area can be computed using one of the formulas listed in Table 3-10.
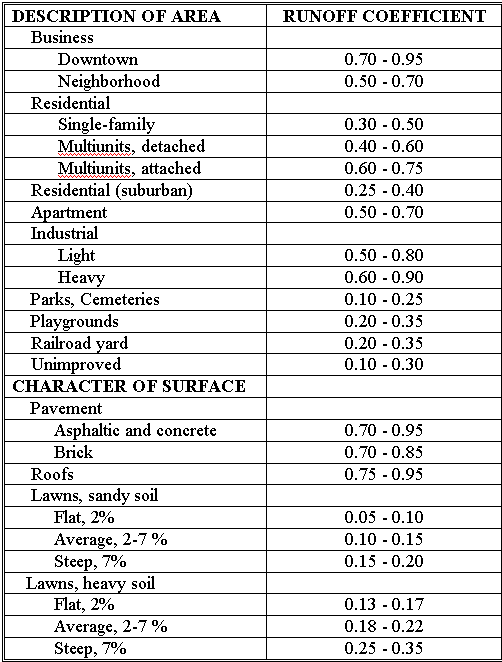
Table: Runoff Coefficients for 2 to 10 Year Return Periods
| Description of drainage area | Runoff coefficient | ||
| Business | Downtown | 0.70-0.95 | |
| Neighborhood | 0.50-0.70 | ||
| Residential | Single-family | 0.30-0.50 | |
| Multi-unit detached | 0.40-0.60 | ||
| Multi-unit attached | 0.60-0.75 | ||
| Suburban | 0.25-0.40 | ||
| Apartment dwelling | 0.50-0.70 | ||
| Industrial | Light | 0.50-0.80 | |
| Heavy | 0.60-0.90 | ||
| Parks and cemeteries | 0.10-0.25 | ||
| Railroad yards | 0.20-0.35 | ||
| Unimproved areas | 0.10-0.30 | ||
| Pavement | Asphalt | 0.70-0.95 | |
| Concrete | 0.80-0.95 | ||
| Brick | 0.75-0.85 | ||
| Roofs | 0.75-0.95 | ||
| Lawns | Sandy soils | Flat (2%) | 0.05-0.10 |
| Average (2-7%) | 0.10-0.15 | ||
| Steep (≥7%) | 0.15-0.20 | ||
| Heavy soils | Flat (2%) | 0.13-0.17 | |
| Average (2-7%) | 0.18-0.22 | ||
| Steep (≥7%) | 0.25-0.35 | ||
Source: Nicklow et al. (2006)
Table 3-10: Formulas for Computing Time of Concentration
| Method | Formula | |
| Kirpich (1940) | L = length of channel (ft) S = average watershed slope (ft/ft) |
|
| California Culverts Practice (1942) | 
L = length of the longest channel (mi) H = elevation difference between divide and outlet (ft) |
|
| Izzard (1946) | 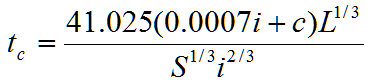
i = rainfall intensity (in/h) c = Retardance coefficient |
Retardance factor, c, ranges from 0.007 for smooth pavement to 0.012 for concrete and to 0.06 for dense turf; product i times L should be < 500 |
| Federal Aviation Administration (1970) | 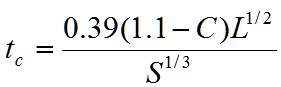
C = rational method runoff coefficient (see Table 3.9) |
|
| Kinematic wave | 
n = Manning’s roughness coefficient |
|
| SCS lag equation | 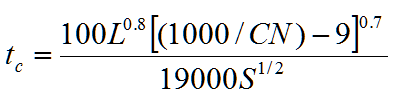
CN = SCS runoff curve number (see Table 3.11) |
|
| SCS average velocity charts | 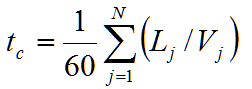
V = average velocity (ft/s) |
|
| Yen and Chow (1983) | 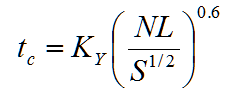
KY = Coefficient N = Overland texture factor (see Table 3.13) |
KY ranges from 1.5 for light rain (i<0.8) to 1.1 for moderate rain (0.8<i<1.2), and to 0.7 for heavy rain (i>1.2) |
Source: Nicklow et al. (2004)
Table 3-11: Runoff Curve Numbers for Urban Land Uses
| Land use description | Soil Group | |||
| A | B | C | D | |
| Lawns, open spaces, parks, golf courses: | ||||
| Good condition: grass cover on 75% or more area | 39 | 61 | 74 | 80 |
| Fair condition: grass cover on 50% to 75% of area | 49 | 69 | 79 | 84 |
| Poor condition: grass cover on 50% or less of area | 68 | 79 | 86 | 89 |
| Paved parking lots, roofs, driveways, etc | 98 | 98 | 98 | 98 |
| Streets and roads: | ||||
| Paved with curbs and storm sewers | 98 | 98 | 98 | 98 |
| Gravel | 76 | 85 | 89 | 91 |
| Dirt | 72 | 82 | 87 | 89 |
| Paved with open ditches | 83 | 89 | 92 | 93 |
| Commercial and business areas (85% impervious) | 89 | 92 | 94 | 95 |
| Industrial districts (72% impervious) | 81 | 88 | 91 | 93 |
| Row houses, town houses and residential with lot sizes of 1/8 ac or less (65% impervious) | 77 | 85 | 90 | 92 |
| Residential average lot size: | ||||
| 1/4 ac (38% impervious) | 61 | 75 | 83 | 87 |
| 1/3 ac (30% impervious) | 57 | 72 | 81 | 86 |
| 1/2 ac (25% impervious) | 54 | 70 | 80 | 85 |
| 1 ac (20% impervious) | 51 | 68 | 79 | 84 |
| 2 ac (12% impervious) | 46 | 65 | 77 | 82 |
| Developing urban area (newly graded; no vegetation) | 77 | 86 | 91 | 94 |
Adapted from SCS (1985)
Table 3-12: Description of NRCS Soil Classifications
| Group | Description | Min. infiltration (in/hr) |
| A | Deep sand; deep losses; aggregated silts | 0.30-0.45 |
| B | Shallow loess; sandy loam | 0.15-0.30 |
| C | Clay loams; shallows sandy loam; soils low in organic content; soils usually high in clay | 0.05-0.15 |
| D | Soils that swell significantly | 0-0.05 |
Adapted from SCS (1985)
Table 3-13: Overland Texture Factor N
| Overland flow surface | Low | Medium | High |
| Smooth asphalt pavement | 0.010 | 0.012 | 0.015 |
| Smooth impervious surface | 0.011 | 0.013 | 0.015 |
| Tar and sand pavement | 0.012 | 0.014 | 0.016 |
| Concrete pavement | 0.014 | 0.017 | 0.020 |
| Rough impervious surface | 0.015 | 0.019 | 0.023 |
| Smooth bare packed soil | 0.017 | 0.021 | 0.025 |
| Moderate bare packed soil | 0.025 | 0.030 | 0.035 |
| Rough bare packed soil | 0.032 | 0.038 | 0.045 |
| Gravel soil | 0.025 | 0.032 | 0.045 |
| Mowed poor grass | 0.030 | 0.038 | 0.045 |
| Average grass, closely clipped sod | 0.040 | 0.055 | 0.070 |
| Pasture | 0.040 | 0.055 | 0.070 |
| Timberland | 0.060 | 0.090 | 0.120 |
| Dense grass | 0.060 | 0.090 | 0.120 |
| Shrubs and bushes | 0.080 | 0.120 | 0.180 |
| Land use | Low | Medium | High |
| Business | 0.014 | 0.022 | 0.35 |
| Semi-business | 0.022 | 0.035 | 0.050 |
| Industrial | 0.020 | 0.035 | 0.050 |
| Dense residential | 0.025 | 0.040 | 0.060 |
| Suburban residential | 0.030 | 0.055 | 0.080 |
| Parks and lawns | 0.040 | 0.075 | 0.120 |
Adapted from Yen and Chow (1983)