How to Make Scatter Graphs
How to Make Scatter Graphs in InfoSWMM, InfoSWMM SA and H2OMap SWMM
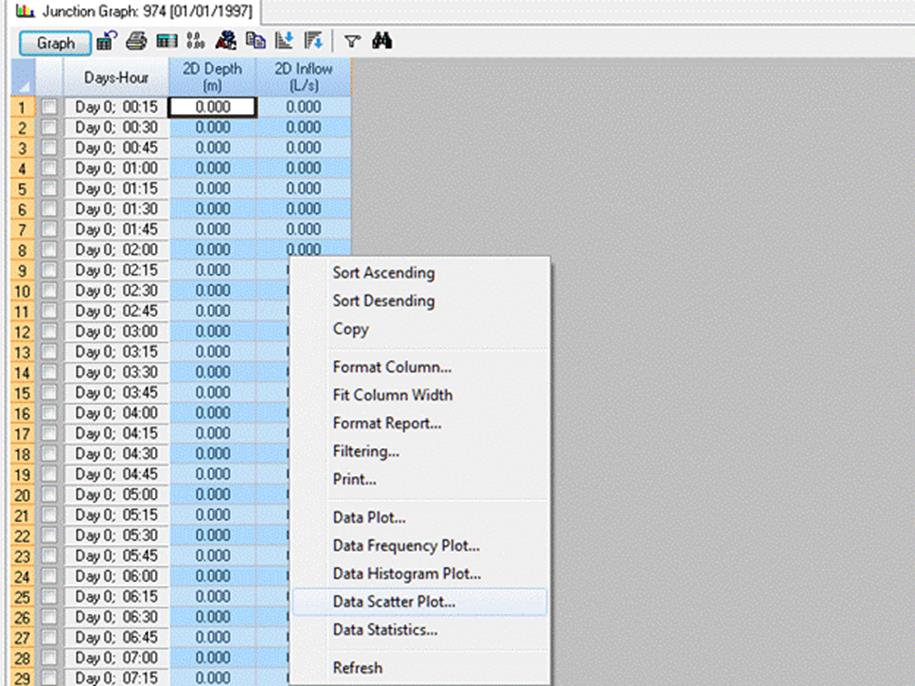
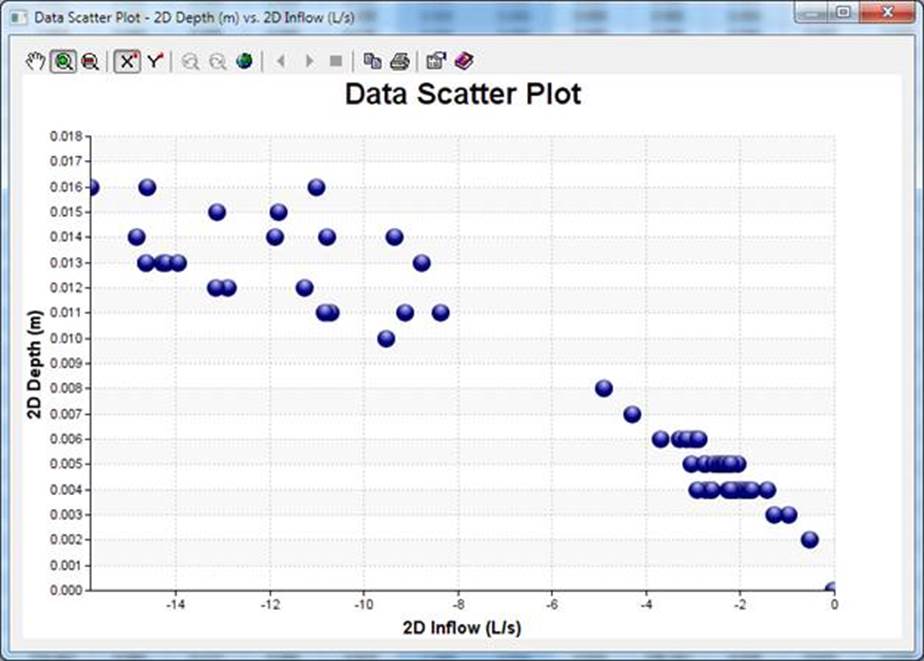
Scatter graphs of velocity on the X axis and depth on the Y axis are important to help understand the reason for flow/depth relationships in flow surveys. You can make a scatter graph in InfoSWMM by plotting the link flow and the by clicking on the Report button. A right mouse click will bring up the Data Scatter Plot option. The column on the left of the selected columns will be the X Axis column of data. The column on the right will be the Y Axis column of data. The default is depth followed by velocity. The order variables can be changed by using the Format Icon (bullet 1) followed by the Scatter Plot selection of velocity/depth (see Figure 1 for an example). Figure 2 shows how to make a Log/Log Scatter Graph in InfoSWMM using the Properties Icon.

Figure 1 The Basic Velocity vs Depth Scatter Graph in InfoSWMM |
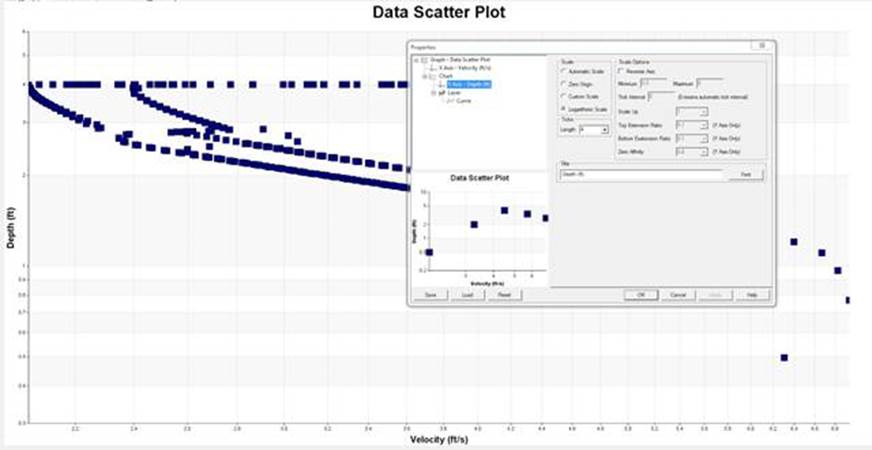
Figure 2. The Log/Log Options for a Scatter Graph.
|