RDII or Tri Triangular Unit Hydrograph in InfoSewer
The RDII or Rainfall Dependent Infiltration Inflow method in InfoSewer is similar to the RDII or RTK method in InfoSWMM and InfoWorks ICM, but there are some differences. The RTK data for triangles 1, 2, and 3 are defined in the Unit Hydrograph, but instead of individual R values, the overall R is set, and the Percent R1, R2, and R3 are defined based on the total R. R3 is internally calculated as 100 – R1 – R2.
Each loading manhole with RDII flow has a total area, a hyetograph, and a Unit Hydrograph. The hyetograph must be set to multiples of the unit hydrograph, so define the time or X columns with integers and then use the Block Edit command to change X to minutes by multiplying by the Unit Hydrograph time (Figure 1).
You can only use one component if you set R1 or R2 to 100% or R3 to 100% by setting R1 and R2 to 0%. (Figure 2).
The overall area of the Unit Hydrograph is divided among the loading manholes using the Subbasin Area (Figure 3).
The storm flows generated can be visualized using a Group Graph (Figure 4), and the area of the loading manholes is proportional to the total area of the defined unit hydrograph (Figure 5).
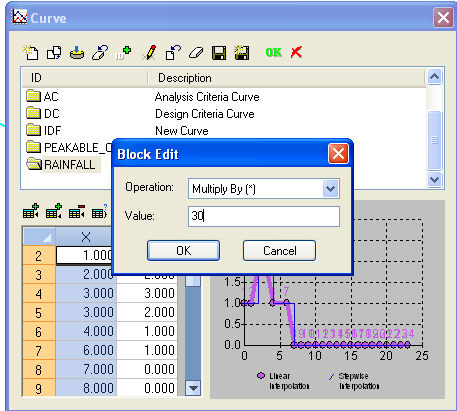
Figure 1. Hyetograph Curve for the RDII Unit Hydrograph
Figure 2. The Unit Hydrograph is defined for various values of R, R1, R2, T1, T2, T3, K1, K2 and K3
Figure 3. The-Unit-Hydrograph-and-Hyetograph-are-tied-to-a-particular-loading-manhole-using-a-Subbasin-Area
Figure 4. The Unit Hydrographs that are generated can be viewed using a Group loading Manhole Graph. The R1, R2 and R3 have only one triangle