How to See the Highest Continuity Errors Table in the Output Report Manager
In the output text report file of InfoSWMM, InfoSWMM SA and SWMM5 there is the Highest Node Continuity Error Table. The Table shows the highest 20 Nodes for percent node continuity errors and the actual continuity error as defined by Node Outflow - Node Inflow. This table is also shown in the Output Report Manger table ![]()

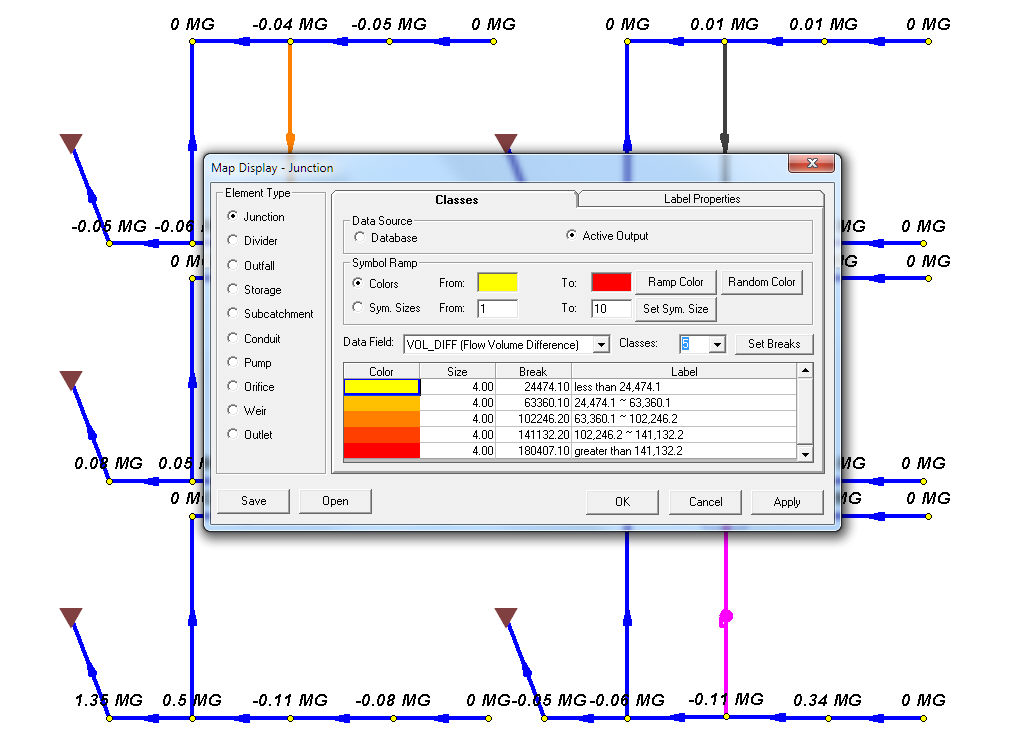
The same value of Node Outflow - Node Inflow is shown in the Junction Summary table under the column flow volume difference. The units of flow volume difference will be the same as the RPT file if the units are changed in the Output Unit Manger.

How to change the volume units in the Output Unit Manger. Change the volume to MG or ML (for SI units).

The flow volume difference can also be seen in Map Display by picking the Active Output variable Vol_Diff or Flow Volume Difference.
Privileged and Confidential Communication: This electronic mail communication and any documents included hereto may contain confidential and privileged material for the sole use of the intended recipient(s) named above. If you are not the intended recipient (or authorized to receive for the recipient) of this message, any review, use, distribution or disclosure by you or others is strictly prohibited. Please contact the sender by reply email and delete and/or destroy the accompanying message.