Example 3. Detention Pond Design in InfoSWMM and InfoSWMM SA
This example illustrates how to define, design, and evaluate a detention pond using InfoSWMM H2OMap SWMM InfoSWMM SA. Storage units, orifices and weirs will be used to model a multi-purpose detention pond built to detain a water quality capture volume (WQCV) and control peak post-development release rates to their pre-development levels. The urban catchment studied in Examples 1 and 2 will also be used in this example.
Storage is widely used in urban runoff quantity and quality control, providing both peak flow reduction and suspended solids removal. The design criteria for storage structures have changed over time due to an improved understanding of the effects that urban runoff has on the environment. Facilities must control not only the extreme runoff events to prevent flooding, but also the more common smaller events that produce a “first flush” pollution phenomenon and thereby impact the quality of receiving water bodies.
3.1 Problem Statement
In Example 1 a model was built to estimate the pre-development runoff from a 29 acre site. Additional scenarios were constructed to estimate the site’s post-development runoff both without flow routing (Example 1) and with routing through a surface collection system (Example 2). Total site runoff for the 2-, 10- and 100-yr design storms was computed for both the pre- and post-development conditions. Based on the results of these scenarios, it is now required to design a detention pond immediately downstream of the planned urban development to both prevent flooding and protect water quality in a receiving stream. It is required that the pond reduce the peak discharges of the 2-, 10- and 100-yr storms to those of the undeveloped site, and that extended detention be provided for a specific water quality capture volume.
Table 3-1 shows the discharges to be controlled by the pond. The pre-development peaks were determined in Example 1 (Table 1-9 in Section 1.5) and post-development peaks were determined in Example 2 (Table 2‑7 in Section 2.5). The InfoSWMM scenarios that produced these results are EX1-PRE and EX2-POST, respectively.
Table 3-1. Pre- and post-development peak discharges
| Return Period (yr) | Rainfall Depth (in) | Pre-development Peak Discharge (cfs)1 | Post-development Peak Discharge (cfs)2 |
| 2 | 0.98 | 4.14 | 33.5 |
| 10 | 1.71 | 7.34 | 62.3 |
| 100 | 3.67 | 31.6 | 163.8 |
1From EX1-PRE scenario
2From EX2-POST scenario
In addition to controlling the discharges listed, it is required that a Water Quality Capture Volume (WQCV) be controlled. The WQCV is defined as a suitable volume expressed in units of watershed depth that is detained for a long enough period of time to achieve a targeted level of pollutant removal. The required volume and drawdown time vary under different stormwater control policies (Akan and Houghtalen, 2003). In this example, the WQCV must be Release over 40 hours, during which a significant portion of particulate pollutants found in urban stormwater are removed. Finally, for safety reasons, a maximum storage depth of 6 ft is considered for the final design. In this example the minor storms ( the WQCV and 2-yr storm) and the major storms (the 10- and 100-yr storms) runoff will be detained in separate sections of the detention pond. Both sections will have the shape of a trapezoidal prism. The location of the pond within the developed study area is shown in Figure 3‑1.

Figure 3-1. Detention pond location for the post-development site
3.2 System Representation
The main elements used to design detention ponds in InfoSWMM H2OMap SWMM InfoSWMM SA are storage units with orifice and weir outlets. These three elements are described below:
· Storage units
Storage units in InfoSWMM H2OMap SWMM InfoSWMM SA are modeled as nodes. They are similar to the conveyance-system junction nodes introduced in Example 2 but have some fundamental differences: storage volume is described by a Storage Curve, an Evaporation Factor can be specified, and a Maximum Depth of storage must be defined. Infiltration loss into the surrounding soil can also be modeled if desired
o Storage Curve: This curve defines the shape of a storage unit by describing how the surface area within the unit varies with water depth. This curve is integrated by InfoSWMM H2OMap SWMM InfoSWMM SA to compute stored volume as a function of depth. It can be specified to the model as either a functional equation or as a tabular curve (area-depth pair data).
o Evaporation Factor: To allow evaporation from the surface of a storage unit one sets its Evaporation Factor to 1 and provides evaporation data to the model using InfoSWMM H2OMap SWMM InfoSWMM SA’s Climatology Editor. The default value for this parameter is 0, implying that evaporation is ignored.
o Maximum Depth: The maximum depth of a storage unit must be defined and should not be left at the default zero value. If the storage unit’s depth is not defined, the model will assume the storage unit has a zero depth even if a storage curve has been assigned or a conduit is connected to the storage unit. If the largest depth on the storage curve is below the maximum depth, the last area value on the curve will be extended outward (i.e. extrapolated).
o Infiltration: If loss of volume to the soils surrounding the pond is of interest, infiltration parameters can be specified. The Green-Ampt infiltration equation is used and fields are available to specify capillary suction, hydraulic conductivity and initial moisture deficit for each pond.
· Orifices
InfoSWMM H2OMap SWMM InfoSWMM SA’s orifice-type link can be used to represent the opening along the side or bottom of the storage unit that serves as an outlet. The upstream node of the orifice is the storage unit while its downstream node would be a junction that connects it to a downstream conduit. Orifice properties that need to be defined include its height above the bottom of the storage unit (invert offset), its type (side or bottom orifice), its geometry (rectangular or circular shape and the respective dimensions) and its hydraulic properties (discharge coefficient and the presence/absence of a flap gate to prevent backflows).
· Weirs
InfoSWMM H2OMap SWMM InfoSWMM SA’s weir-type link can be used to represent the opening at the top of the storage unit that serves as an overflow structure. As with the orifice, the upstream node of the weir is the storage unit while its downstream node connects it to a downstream conduit. Weir properties that need to be defined include the weir’s height above the bottom of the storage unit, its type (transverse, V-notch or trapezoidal), its geometry and its hydraulic properties (discharge coefficients, end contractions and the presence/absence of a flap gate to prevent backflows).
3.3 ![]() Model Setup
Model Setup
InfoSWMM H2OMap SWMM InfoSWMM SA can be used to model storage facilities that capture runoff from different design storms and release it to a receiving channel at a controlled rate. This example demonstrates how the design of a storage pond is an iterative process in which the dimensions of the pond and its outlets are changed to satisfy the design criteria and constraints for the design storms considered. The three main steps used to design the storage pond are:
1. Estimate the water quality capture volume (WQCV).
2. Size the storage volume and the outlet to control the release rate of the WQCV.
3. Size the storage volume and the outlet to control the peak runoff rates from the 2-, 10- and 100-yr design storms.
The final design will be a storage unit with a shape specific to its location, rainfall and climate conditions; a defined relationship between its surface area and storage depth; and a multi-outlet structure designed to control different runoff events. Figure 3-2 shows the schematic of a detention pond and its outlets designed to control a WQCV and the peak discharges for three design storms. The stacked trapezoidal prism shape shown in this figure will be used in this example; the upper prism will control the major storms (10- and 100-yr) while the lower prism will control the minor storms (WQCV and 2-yr).
Note that the discharge for different storms is controlled by a combination of orifices and weirs rather than a single unique outlet. Orifice 1 in Figure 3-2 controls the release of the WQCV; orifices 1 and 2 control the release of the 2-yr storm; orifices 1, 2 and 3 control the release of the 10-yr storm and all the orifices combined together with the weir (4) control the release of the 100-yr storm.
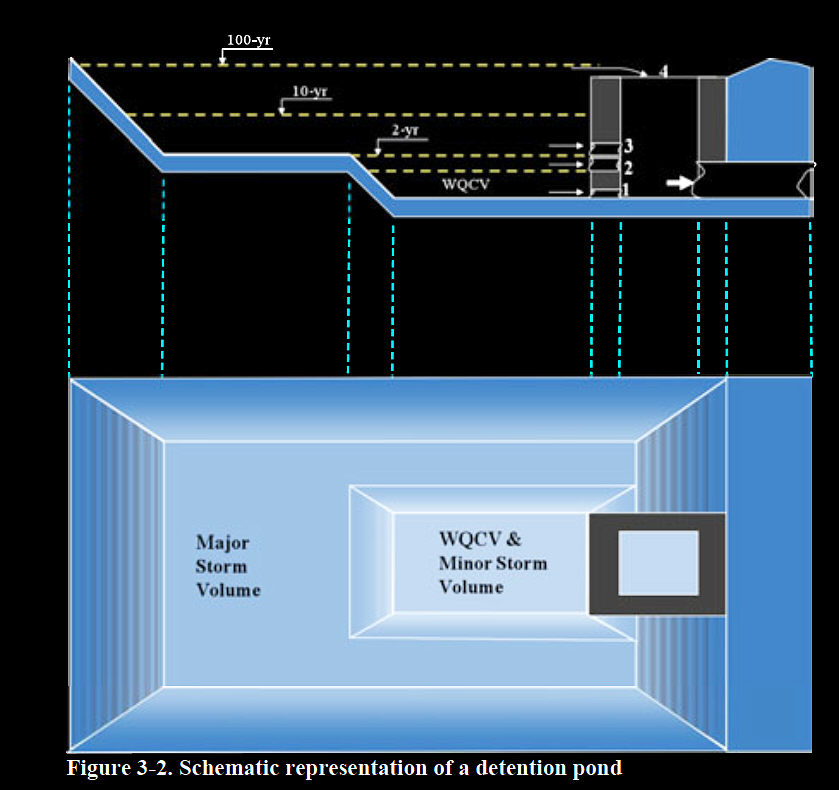
Figure 3-2. Schematic representation of a detention pond
Estimation of the Water Quality Capture Volume
The WQCV is the critical runoff volume to be used in the design of stormwater quality enhancement facilities. Detailed investigation based on calibrated long-term runoff simulations is the preferred method to determine this volume for a given site (Guo and Urbonas, 1996). However, several methodologies or “rules of thumb” have been proposed to estimate the WQCV that are simpler to use but still reliable when long-term records are not available (see for instance Guo and Urbonas, 1995, 1996 and 2002; Water Environment Federation, 1998). This example will use the methodology proposed by the UDFCD (2001). Figure 3-3 shows the curves defined in this methodology to estimate the WQCV as a function of the tributary catchment’s total imperviousness and the drain time of the capture volume. The following steps are used to estimate the WQCV for the detention basin being designed in this example:
1. First, determine the developed site’s average Directly Connected Impervious Area (DCIA). DCIA is the impervious area that is directly connected to the stormwater drainage system; it does not include rooftops, patios, etc. that drain to lawns or other pervious areas, and is smaller than the gross or total impervious area that is typically estimated through aerial photography. These areas were previously estimated for each of the seven Subcatchments defined for the post-development site condition in Example 1 and are presented in Table 3-2.
Figure 3-3. Water quality capture volume (UDFCD, 2001)
Table 3-2. Post-development Subcatchment data
| Subcatchment | S1 | S2 | S3 | S4 | S5 | S6 | S7 |
| Area (ac) | 4.55 | 4.74 | 3.74 | 6.79 | 4.79 | 1.98 | 2.33 |
| Imperviousness (%) | 56.8 | 63.0 | 39.5 | 49.9 | 87.7 | 95.0 | 0 |
2. Next calculate the site’s average percent imperviousness by weighting the imperviousness of each Subcatchment by its area and dividing by the total area (28.94-ac) of the study area. The average percent imperviousness of the site determined by this method is 57.1% ≈ 57%.
3. The next step is to determine the WQCV in watershed inches. Assume that the example site is located in Colorado’s high plains near the foothills and that the storage unit is to have a 40 hr drain time. From Figure 3-3 the corresponding WQCV in watershed inches is 0.23 in. Thus the total water quality control volume is 28.94ac·0.23 in/12 = 0.555 acre-ft or 24,162 ft3.
4. If the design location were not in Colorado’s high plains near the foothills, one would need to adjust the WQCV determined from Figure 3-3. The curves shown in Figure 3-3are defined to control the 80th percentile runoff event and are appropriate for use in Colorado’s high plains near the foothills. For other locations, the WQCV from Figure 3-3 can be adjusted to obtain an appropriate volume, WQCVo, using Equation 3-1. In this equation, d6 is the average precipitation depth of the runoff-producing storms. Storm events for Equation 3-1 were defined for a 6-hour inter-event period and have a minimum depth of 0.1 in. Figure 3-4 shows estimates of d6 for the contiguous United States (UDFCD, 2001).
(3-1)
Figure 3-4. Average depth (inches) of runoff producing storms in the US (Driscoll, et al., 1989)
Pond Geometry and Dimensions
The shape of the storage unit will depend on the regulations in the location where the structure will be constructed. Generally, it is recommended that the distance between the inlet and outlet of the facility be maximized; a length to width ratio of 2:1 to 3:1 is adequate. This example will use a length to width ratio of 2:1, a WQCV depth (h1) of 1.5 ft, and a side slope of 4:1 (H:V). Figure 3‑5 shows the geometry of the WQCV and equations developed based on the length to width ratio (2:1) and the storage unit side slope (4:1) that describe the unit’s geometry. The steps used to determine the dimensions of the WQCV are:

Figure 3-5. Geometry of the pond's WQCV
1. Solve for L3 using the WQCV found in the previous section (24,162 ft3) and h1 equal to the WQCV depth (1.5 ft). Rearranging the fifth equation listed in Figure 3‑5 yields the following quadratic equation for L3:

Solving for L3 gives L3 = 85.15 ft ≈ 86 ft.
2. Next solve for the other dimensions of the WQCV using L3 and h1. From the first equation from the top in Figure 3‑5, L1 = 170.3 ft ≈ 171 ft, from the second equation L2 = 184 ft, and from the third equation L4 = 98 ft.
3. Then define the storage curve for the WQCV portion of the storage unit. At 0 depth the area is L1·L3 = 14,706 ft2 while at the full depth of 1.5 ft the area is L2·L4 = 18,032 ft2. These pairs will be entered into the model in the following section together with new points in the surface area-depth curve representing the shape shown in Figure 3-2 to control larger volumes.
Adding a Storage Unit to the Model
The EX2-POST scenario will be used as a starting point to add a storage unit into the model that represents the detention pond (the end result will be scenario EX3). The following steps are taken to define the storage unit.
1. A new Storage Curve object named SU1 is created to represent the shape of the storage unit.
2. The two previously determined depth-area points are entered into the Curve Editor dialog for curve SU1. These two points are d1 = 0, A1 = 14706 ft2 and d2 = 1.5 ft, A2 = 18032ft2.
3. A new storage unit node, also named SU1, is placed onto the study area map as shown in Figure 3‑6, and is left disconnected from the drainage system. The following properties are assigned to SU1; Storage Curve = Tabular; Curve Name = SU1; Invert Elevation = 4956 ft (six feet lower than the outfall node elevation defined in the previous examples); Maximum Depth and Initial Depth = 1.5 ft (the maximum allowable depth defined to control the WQCV).
4. An additional node (J_out), conduit (C_out) and outfall node (O2) are added that will connect the orifices and weirs draining the storage unit (SU1) to the outfall node (O2). This must be done because it is not possible to connect more than one hydraulic link to an outfall node in InfoSWMM. The invert elevations of J_out and O2 are set to 4954 ft to avoid backwater effects (again, details in the geometric definition of the storage unit will depend on the local conditions and it is not the intention of this example to cover these details) and C_out is given a length of 100 ft and a roughness of 0.01. Figure 3-7 shows the storage unit’s Properties table.
Initially, the storage unit and its WQCV orifice are modeled independent of the watershed to size the WQCV orifice to drain in 40 hours. Although the storage unit and the watershed are shown in the same model in Figure 3-6, they will run as independent systems in the model because they are not hydraulically connected. The location of the pond in Figure 3-6 will be its final location in the model. The pond could have been placed in the park area since there is significant open space for it, but for clarity it was placed at the downstream end of the park.

Figure 3-6. Southeast portion of study area with storage unit SU1 and outlet structures

Figure 3-7. Properties of storage unit SU1
Sizing the WQCV Orifice
The next step is to design the pond outlet so that the entire WQCV is Release within 40 hours. The outlet will be an orifice connecting the storage unit to the downstream outfall O2. This orifice could be located at the bottom or side of the storage unit and be either circular or rectangular in shape. The following steps are used to size the orifice so the WQCV drains in 40 hours.
1. A side orifice (Or1) is added between the storage unit (SU1) and the node (J_out) leading to the outfall node. It is given a rectangular shape and assigned an inlet offset of zero so that its invert is the same as the storage unit. Its discharge coefficient is assumed to be the default value of 0.65.
2. The simulation time step options are set as follows: reporting, wet-weather and routing time steps to 15 seconds and the dry-weather time steps to 1 hr. The simulation durationmust be longer than 40 hours so that the performance of the orifice can be properly evaluated; this example uses 72 hours.
3. The final dimensions of orifice Or1 are determined by running InfoSWMM several times using Dynamic Wave flow routing while iteratively changing the orifice dimensions until a size is found that drains the WQCV in approximately 40 hours. For each run, the dimensions of the orifice are varied while keeping the initial water depth in the storage unit at the depth of the WQCV, 1.5 ft. One can assume that the basin is essentially empty once the water depth is 0.05 ft. Note that the runoff discharge generated by the rainfall falling on the Subcatchments does not affect the storage unit during this part of the example because it is not connected to the drainage system.
Figure 3-8 shows the drainage time for three iterations as well as that for the final design. Table 3‑3 shows the dimensions assigned to the orifice by iteration. The final orifice design has a height of 0.3 ft and a width of 0.25 ft. This small size is typical of a WQCV orifice. That is why the orifice must be protected by a screen to prevent plugging during the storm and maintenance must be done regularly to ensure the screen remains free of debris.
Table 3-3. Design of the WQCV outlet (Or1)
| Iteration | 1 | 2 | 3 | Final |
| Height (ft) | 0.166 | 0.25 | 0.25 | 0.3 |
| Width (ft) | 0.25 | 0.25 | 0.40 | 0.25 |
| Inlet Offset (ft) | 0 | 0 | 0 | 0 |
| Discharge Coefficient | 0.65 | 0.65 | 0.65 | 0.65 |
| Drainage time (hr:min) | 53:58 | 43:21 | 27:07 | 40:12 |

Figure 3-8. WQCV drainage times for the iterations shown in Table 3-3
Sizing the 2-yr Design Storm Orifice
The runoff volume generated by the 2-yr storm will be larger than the WQCV volume designed for in the previous section. The volume of the storage unit must now be enlarged and a new outlet must be defined. This new outlet, which will be placed at a height of 1.5 ft above the basin floor, will begin to discharge when the runoff volume from any storm just exceeds the WQCV. This outlet will control not only the peak runoff rate of the 2-yr storm but also partially control the runoff rate from storms greater than the 2-yr storm. The required increase in storage volume will be achieved by extending the sides of the storage unit above the WQCV depth while keeping a lateral slope of 4:1 (H:V) as shown in the basin schematic, Figure 3‑2. The following steps outline how the storage unit is sized for the 2-yr design storm orifice.
1. The storage unit is first connected to the rest of the drainage system. This can be done by changing culvert C11’s outlet to SU1 and deleting the original outfall node O1 (or by creating a new conduit C12 with the same properties as C11 as implemented in InfoSWMM Applications.mxd). Culvert C11 is given a downstream offset of 1ft so that for minor storms it has no backwater but still has its crown below the top of the storage pond.
2. Next the size of the pond is enlarged for flood control by expanding its height while keeping a constant slope (refer to Figure 3‑2 for an illustration). This is done by entering a new pair of surface area-depth pairs to the storage curve SU1. The values for this new pair are: d3 = 6 ft, A3 = 29583 ft2. The initial depth of the storage unit is set to zero and its maximum depth to 6 ft to account for the new volume.
3. The model is then run for the 2-yr storm using only the WQCV orifice to determine the maximum depth in the storage unit, the peak discharge of the WQCV orifice (Or1), and the time it takes the storage unit to empty. The results show a maximum storage unit depth of 2.82 ft, a maximum orifice discharge of 0.64 cfs and an emptying time of 56:23 (hr:min).
4. Based on the results in step 3, the peak outflow for the 2-yr storm can be increased because the pre-development 2-yr peak runoff (4.14 cfs from Table 3-1) is larger than the discharge through the WQCV orifice (0.64 cfs). Increasing this discharge is advantageous because it will reduce the final volume of the storage required and save in costs. To increase the 2-yr storm pond outflow, a second orifice (Or2) is added directly above the WQCV depth (inlet offset = 1.5 ft) as illustrated in Figure 3‑2. This orifice is assigned a rectangular shape with an inlet offset of 1.5 ft and a discharge coefficient of 0.65. It should be drawn on the map with at least one intermediate vertex so that it can be distinguished from the existing orifice Or1.
6. Running the model with these dimensions for Or2 produces a discharge of 2.84 cfs. This value is less than the target discharge (4.14 cfs). Therefore, iterations must again be used to size orifice Or2 as was done for Or1 until the combined peak discharge of the two orifices is equal to or a little less than the 2-yr pre-development peak discharge (4.14 cfs).
7. To simplify the iterations for sizing Or2 its height is fixed at 0.5 ft and its width is varied in 0.05 ft increments until the combined discharge of both orifices is close to 4.14 cfs. A size of 0.5 by 2 ft produces a peak discharge of 4.11 cfs and a maximum storage unit depth of 2.21 ft. These dimensions will thus be used for the 2-yr orifice.
Sizing the 10-yr Design Storm Orifice
Up to this point the storage unit has been represented as a single trapezoidal prism. This shape was determined for the WQCV back in the “Pond Geometry and Dimensions” section and increased in size (keeping the 4:1 side slope) to contain the 2-yr storm runoff. In this section the storage unit shape is redefined by adding an additional trapezoidal prism over the minor storm prism to contain the 10- and 100-yr storm volumes (See Figure 3‑2). The steps below show how this is done to size the 10-yr storm orifice:
1. The storage curve SU1 is modified by replacing the surface area-depth pairs d2,A2 and d3, A3 with the following three surface area-depth pairs: d2 = 2.22 ft, A2 = 19659 ft2; d3 = 2.3 ft, A3 = 39317 ft2 and d4 = 6 ft, A4 = 52644 ft2. Note that the new d2, A2 point is the highest point of the original shape (the maximum height of the 2-yr storm) . The area of point 3 (A3 = 39317 ft2) doubles the area of point 2 (A2 = 19659 ft2). The depth, d3 is set 0.1 feet above d2 so that the change in cross sectional area is not too abrupt. In practice this transitional area would have a slope of 2% so that water in storage will drain into the smaller basin after the storm. The area of point 4 is computed by extending the sides of the storage unit above the point 3 while keeping a lateral slope of 4:1 (H:V).
2. The model is run with the 10-yr storm and the existing orifices to determine if a 10-yr storm orifice is needed. The resulting maximum water depth is 3.20 ft and the combined peak discharge from both existing outlets is 6.96 cfs. The pre-development peak discharge for the 10-yr storm is 7.34 cfs which means that the storage unit volume can again be decreased by adding another orifice.
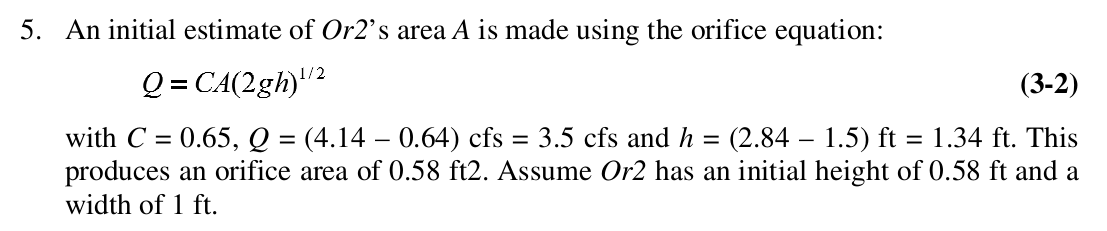
3. A new 10-yr storm orifice (Or3) is added directly above the depth of the volume designed to control the 2-yr storm runoff (inlet offset = 2.22 ft). As with Or2, Or3 is drawn with intermediate vertices so that it can be seen easily on the system map. The orifice equation (Equation 3-2) is used to estimate its required area. For C = 0.65, Q = (7.34 – 6.96) cfs = 0.38 cfs and h = (3.20 – 2.22) ft = 0.98 ft the resulting orifice area is 0.073 ft2. A height of 0.25 ft and a width of 0.25 ft are used as an initial estimate of the orifice’s size.
4. When the model is run with the 10-yr storm for this size of Or3, the combined discharge is 7.22 cfs. Because this discharge is less than the pre-development discharge (7.34 cfs), the orifice’s width is increased to 0.35 ft and the model is re-run. The new combined discharge is 7.32 cfs and the maximum depth in the storage unit is 3.17 ft. This is sufficiently close to the target discharge to accept this orifice size (height = 0.25 ft, width = 0.35 ft)
Designing the 100-yr Weir
The model can now be run with the 100-yr storm using the combined WQCV, 2yr and 10-yr orifices to determine if the 100-yr weir is needed. The peak discharge of these combined orifices for the 100-yr storm is 12.57 cfs, which is not enough to pass the 100-yr storm’s runoff (31.6 cfs), and the storage unit floods. A weir will be designed to control this extreme event so that the pre-development discharge is matched and the total water depth in the pond does not exceed the 6 ft depth that was given as the maximum depth for safety reasons. This is accomplished as follows:
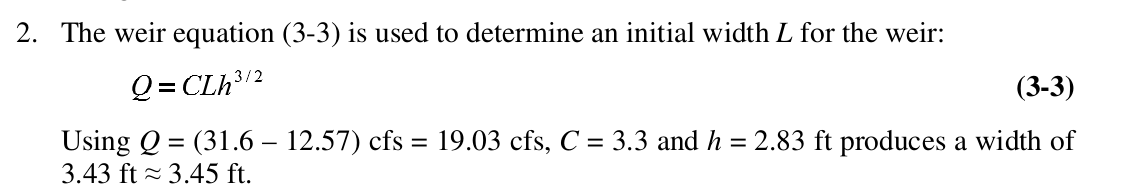
1. A new weir link W1, drawn with intermediate vertices, is added between the storage unit and the node (J_out) leading to the final outfall. It is specified as a transverse weir whose inlet offset is 3.17 ft above the storage unit bottom (the maximum depth reached by the volume controlling the 10-yr storm runoff), and whose discharge coefficient is 3.3. The height of the weir opening is set at 2.83 ft which is the distance between the volume controlling the 10-yr storm runoff and the maximum depth of the storage unit.
3. With weir dimensions of height = 2.83 ft, width = 3.45 ft and invert offset = 3.17 ft the model is run for the 100-yr storm. The resulting peak total discharge from the storage unit is 42.4 cfs which exceeds the target flow of 31.6 cfs.
4. Step 3 is repeated with successively smaller weir widths until a combined discharge close to 31.6 cfs is obtained. A width of 1.75 ft produces a combined 100-yr discharge of 31.2 cfs and a maximum depth of 5.42 ft in the storage unit.
5. The final step is to insure that adequate freeboard is maintained in the storage unit. The current design provides 6.0 – 5.43 = 0.53 ft. The required amount will depend on local design guidelines. For example, the UDFCD (2001) requires a freeboard of 1 foot above the maximum water surface elevation when the weir is conveying the maximum discharge.
3.4 Model Results
The final InfoSWMM H2OMap SWMM InfoSWMM SA model for the post-development site with the detention pond is shown in Figure 3‑9 and its input file is named Example3.inp. Table 3-4 summarizes the characteristics of the different discharge elements included in the pond’s outlet, which are illustrated in Figure 3‑10.
The outflow hydrographs produced by this final design for the detention pond were compared against those resulting with no control as well as against the pre-development discharge targets. Those target discharges were 4.14, 7.34 and 31.6 cfs for the 2-, 10- and 100-yr storms, respectively. The post-development controlled hydrographs were generated using the scenario for the final design of this example (EX3), while the post-development uncontrolled discharges were generated using the final design scenario developed in Example 2 (EX2-POST). The pre-development hydrographs were generated using the final design scenario developed in Example 1 for the pre-development watershed (EX1-PRE). The models were run using a 15 second time step for reporting, wet-weather runoff and flow routing and a 1 hr dry weather runoff time step.
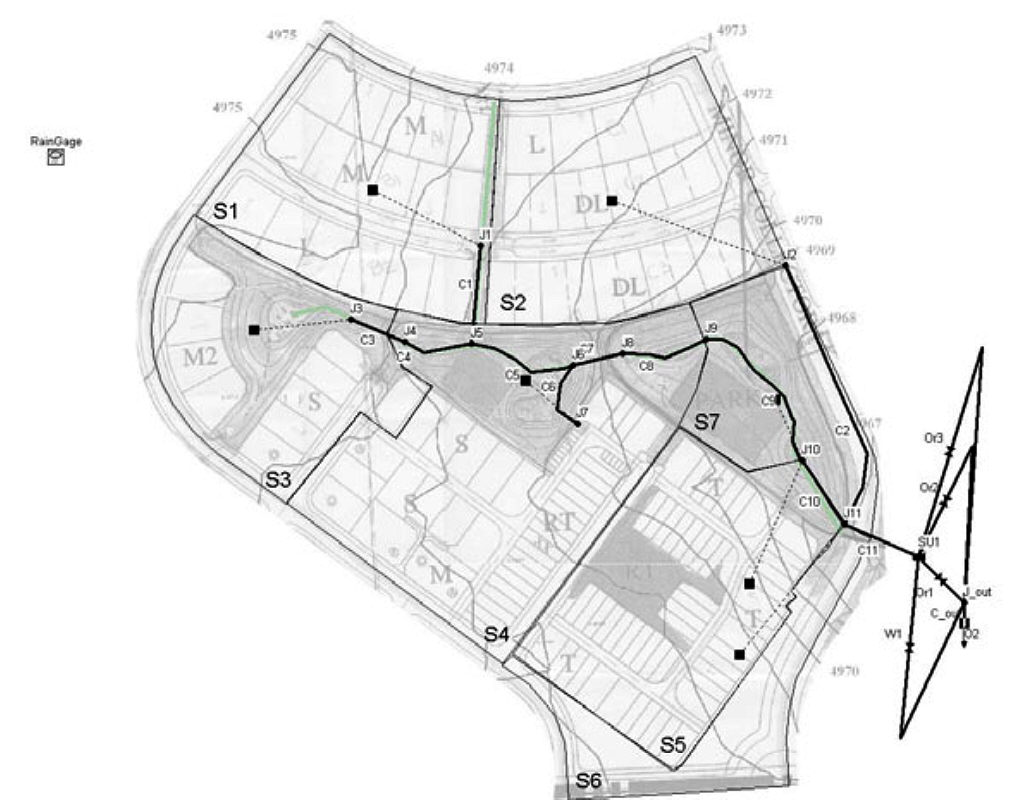
Figure 3-9. Final design of the detention pond and outlet structure
Figure 3-10. Detail of the pond outlet structure
Table 3-4. Characteristics of the pond's outlet structure
| ID | Type of Element | Event Controlled | Shape | Height h (ft) | Width b (ft) | Invert Offset Z (ft) | Discharge Coefficient |
| Or1 | Orifice | WQCV | Side Rectangular | 0.3 | 0.25 | 0 | 0.65 |
| Or2 | Orifice | 2-yr | Side Rectangular | 0.5 | 2.00 | 1.5 | 0.65 |
| Or3 | Orifice | 10-yr | Side Rectangular | 0.35 | 0.35 | 2.22 | 0.65 |
| W1 | Weir | 100-yr | Rectangular | 2.83 | 1.75 | 3.17 | 3.3 |
The resulting sets of hydrographs are shown in Figures 3-11 through 3-13. Output data was copied from the Outfall Graph in Report Manager for O1 and O2 from the appropriate scenario output data and pasted into a spreadsheet application for graphing purposes. They verify that the detention pond was able to control post-development peak discharges from the site to their pre-development levels. Note, however, that the storage unit had no effect on reducing the total volume of post-development runoff that resulted from the large increase in impervious area.

Figure 3-11. Outlet hydrographs for the 2-yr storm
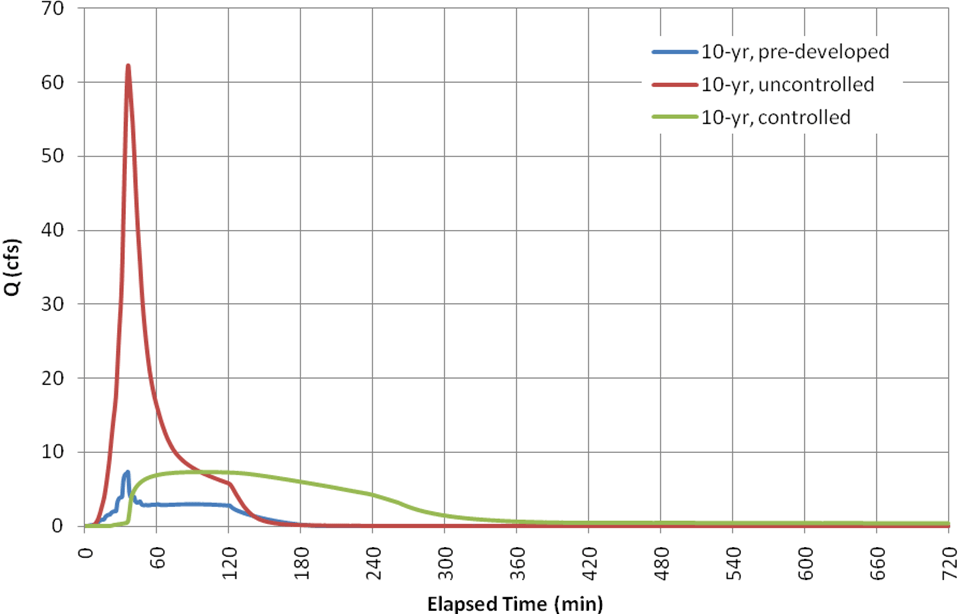
Figure 3-12. Outlet hydrographs for the 10-yr storm
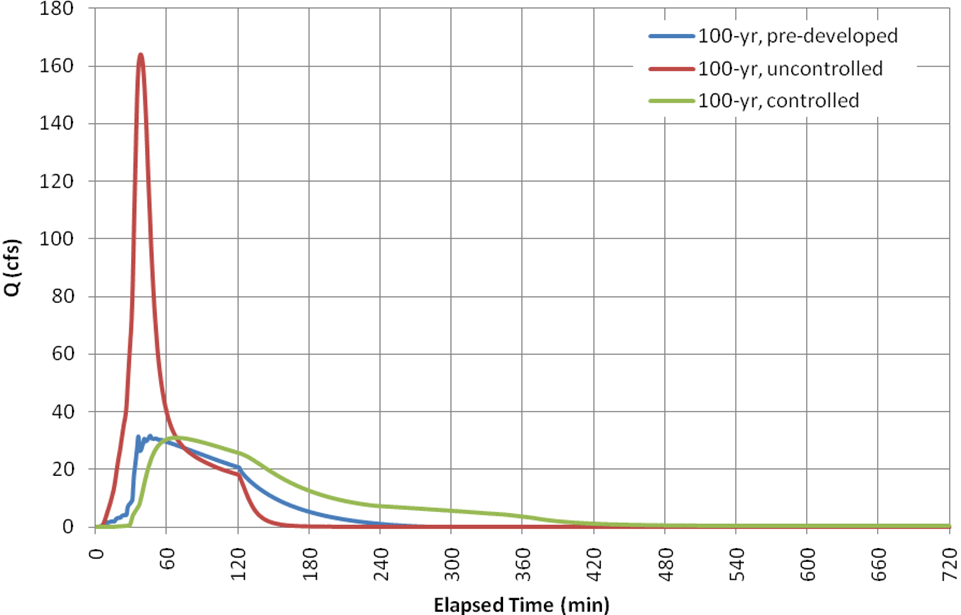
Figure 3-13. Outlet hydrographs for the 100-yr storm
3.5 Summary
This example showed how InfoSWMM H2OMap SWMM InfoSWMM SA could be used to design a detention pond and its outlet structure to provide both a water quality capture volume (WQCV) and peak runoff control. The WQCV was designed to provide a 40 hour drawdown time to satisfy water quality treatment requirements while the peak runoff goal was to limit the maximum post-development discharges for the 2-, 10- and 100-yr storms to their pre-development values. The key points illustrated in this example were:
1. The WQCV’s outlet structure can be designed by using a full storage unit (volume = WQCV) disconnected from the drainage system and an orifice whose dimensions are varied until the storage is drained in a time equal to that defined by local regulation (40 hr in this example).
2. The dimensions of the other component of the outlet structures (e.g. orifices and weirs) used to control peak flows can be designed sequentially. The maximum water depth reached using one design storm is the location of the invert offset of the orifice or weir used to control the next larger design storm.
3. The orifice and weir equations are useful for making initial estimates of an outlet’s dimensions.
4. Although detention storage is effective in controlling peak runoff rates it has no effect on reducing runoff volume.
This example will be extended to include water quality treatment associated with the storage pond in Example 6 and continuous simulation in Example 9.