2016

InfoSWMM, InfoSWMM, Inside SWMM5, SWMM5

How to See the Highest Continuity Errors Table in the Output Report Manager for #InfoSWMM

How to See the Highest Continuity Errors Table in the Output Report Manager for #InfoSWMM

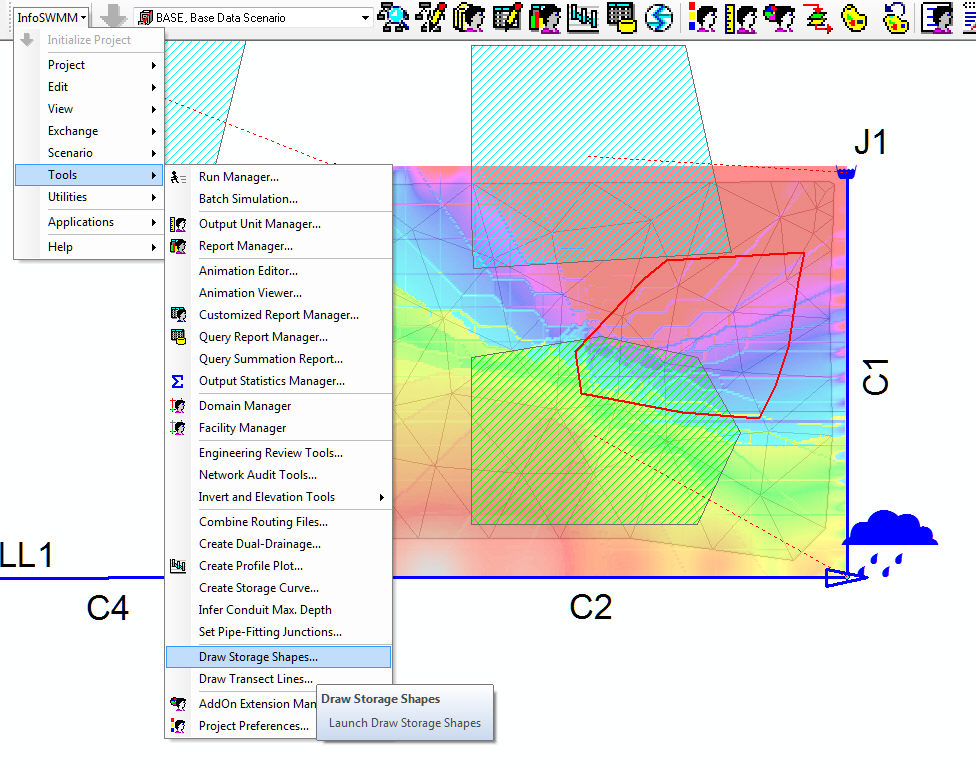
In the output text report file of infoSWMM and H2OMap SWMM there is the Highest Node Continuity Error Table. The Table shows the highest 20 Nodes for percent node continuity errors and the actual continuity … Read the rest

ARC GIS, Hydrology, InfoSWMM, InfoSWMM, LID, Sustain, SWMM5

Infiltration Trench LID Control for #LID’s in #SWMM5 and #InfoSWMM

Infiltration Trench LID Control for #LID’s in #SWMM5 and #InfoSWMM

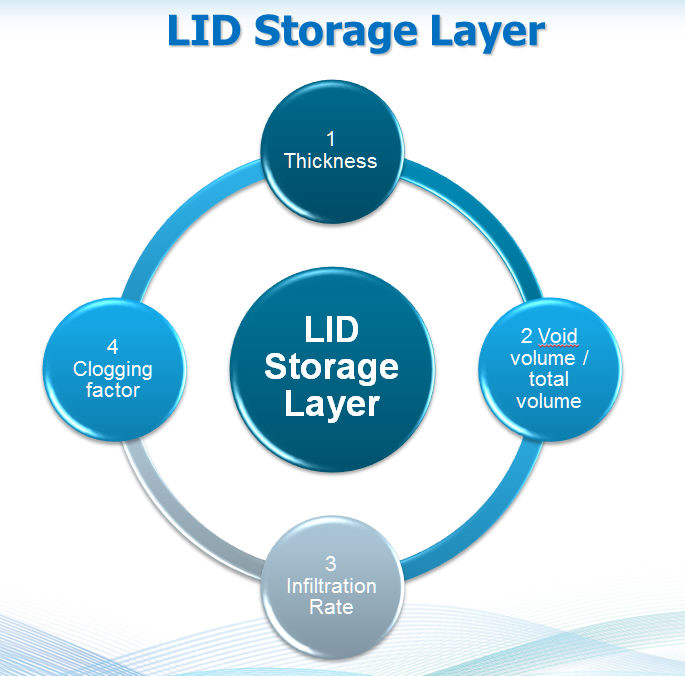
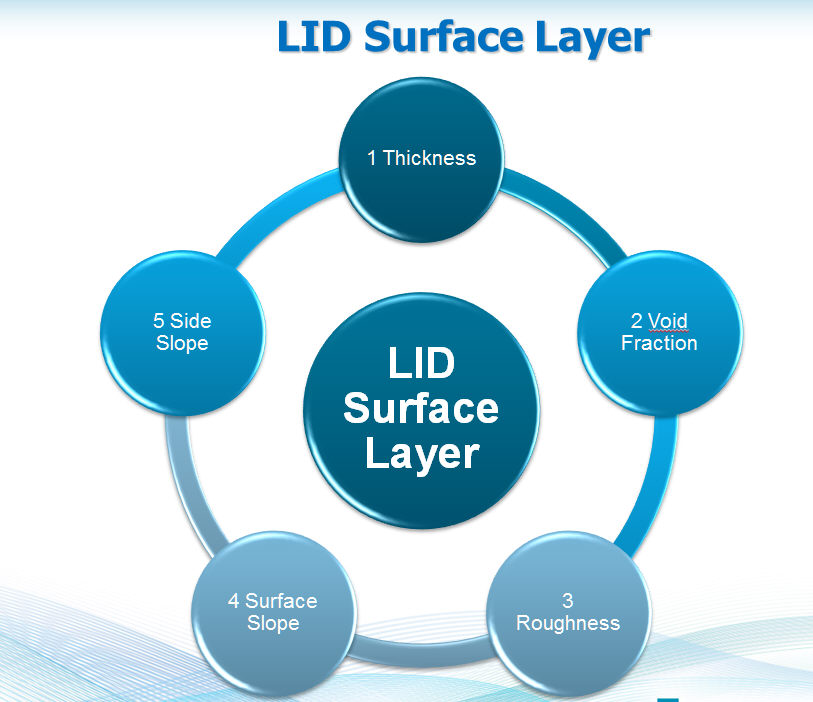
This is an introduction along with images of the LID Control and data require3ments in InfoSWMM. Every InfoSWMM Control uses from one to 5 layers of data – each with different data requirements. You can use the Siting Manger of … Read the rest

ARC GIS, Hydrology, InfoSWMM, InfoSWMM, LID, Sustain, SWMM5

Bio-Retention Cell LID Control in #SWMM5 and #InfoSWMM for Sustain

Bio-Retention Cell LID Control in #SWMM5 and #InfoSWMM for Sustain

This is an introduction along with images of the LID Control and data require3ments in InfoSWMM. Every InfoSWMM Control uses from one to 5 layers of data – each with different data requirements. You can use the Siting Manger of … Read the rest

Translate »
Scroll to Top